|
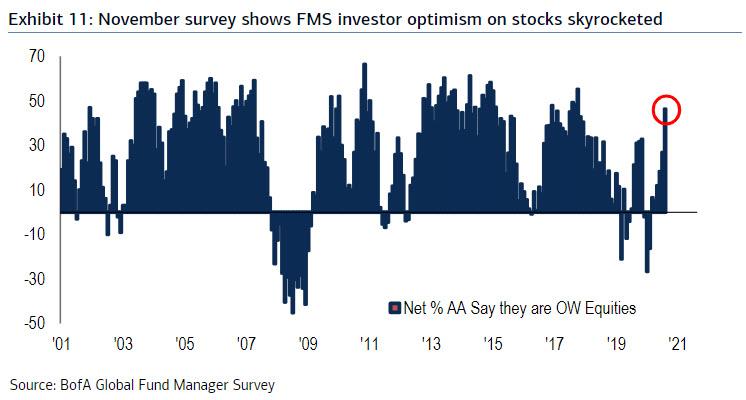
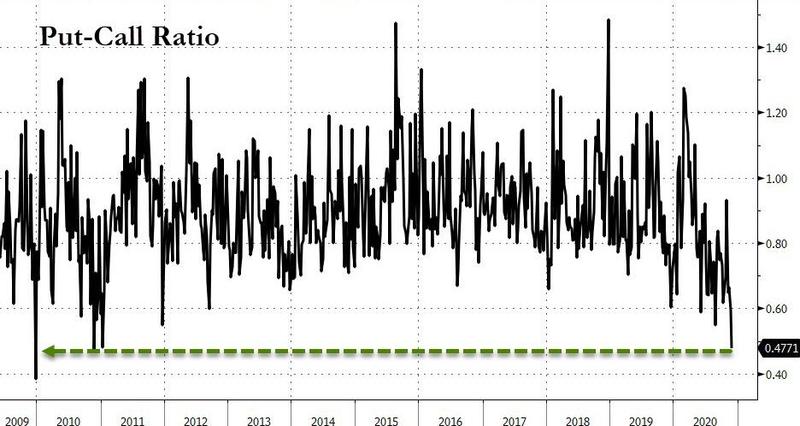
Astonishingly, even after 13 years of failing to deliver on their promises, speculators' trust in central banks and in policy makers is running stronger than ever. On the face of it, all is needed for the economy to boom, jumping all the obstacles popping up on the horizon, is our benevolent government officials and members of parliament, with the help from the (putative) almsgivers at the central banks. Evidently, as I demonstrated several times on this blog, particularly on the three-part-plus-bonus Eurodollar system series (parts I, II, III and bonus), this current monetary system is irredeemable - just like fiat currencies -, despite the smooth talking and alleged mastery central bankers purport. Moreover, the increased government meddling on economic activity has brought about, and will continue to do so, a progressively less dynamic economy with ever more distortions of the production structure, what the Austrian school followers call malinvestments. Accordingly, does the recent renewal in stock markets across the globe, and the financial markets to some extent, have a leg to stand on? Undoubtedly, you already know the answer. Nevertheless, allow me to dig deeper. Due to market participants being full-on risk-on, underestimating, or simply ignoring, all the dangers brewing underneath the surface, complacency is through the roof. One statistic that suggests this is the short interest of the S&P 500 that you see below, which is being historically low. Hence, it is no surprise stocks worldwide are having one of their best months ever. 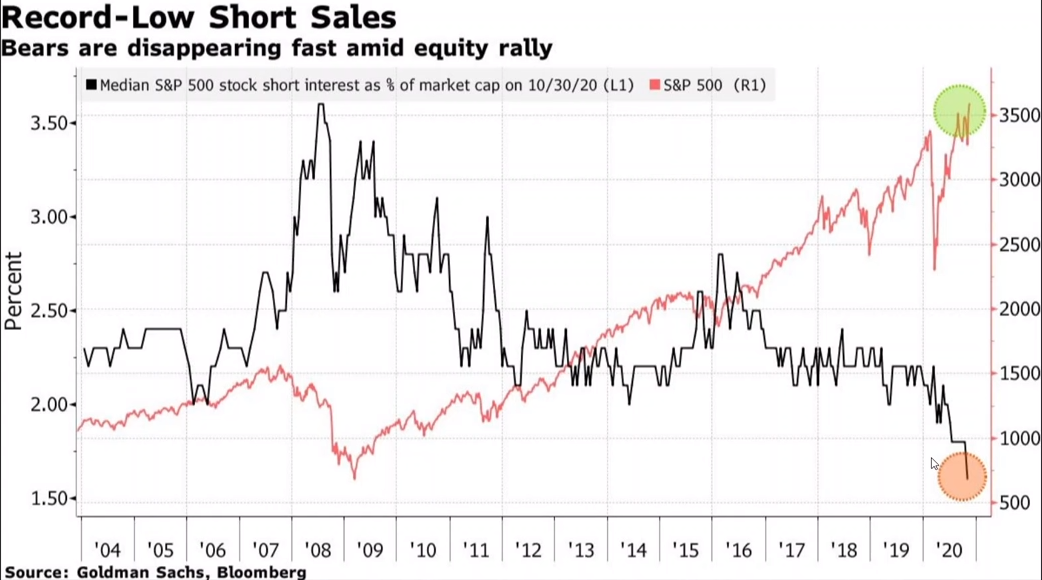 To back up this upturn, here are two more graphs. On the right, the Bank of America Global Fund Manager Survey (FMS) is telling us that investor optimism, as measured by the equity weighting, has not been this high since 2017, when everybody was on the synchronised-global-growth bandwagon. On the left side, the put-to-call ratio, of the S&P 500, has not been this low since the end of 2009, when the GFC was on the rearview mirror and everyone was assuming growth was going to regain its pre-crisis vigor. Ostensibly, empty promises are an extremely powerful drug. The fact that so little insurance (put options) on the event of a crash is being acquired, it speaks volumes on how delusional, or under the influence, investors are.
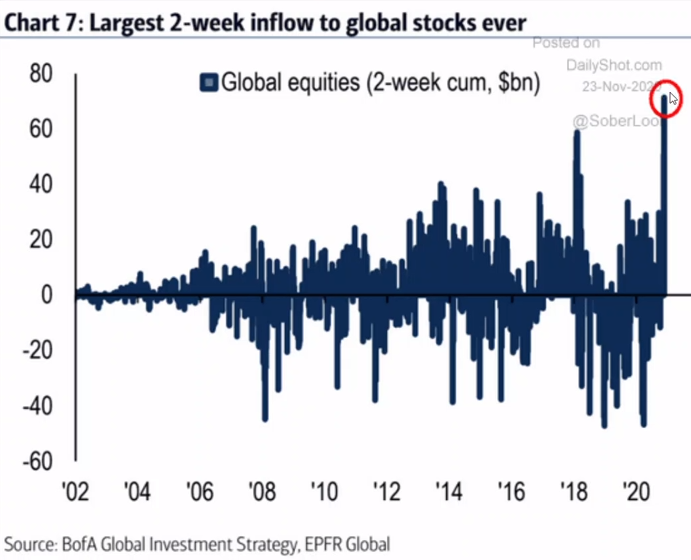
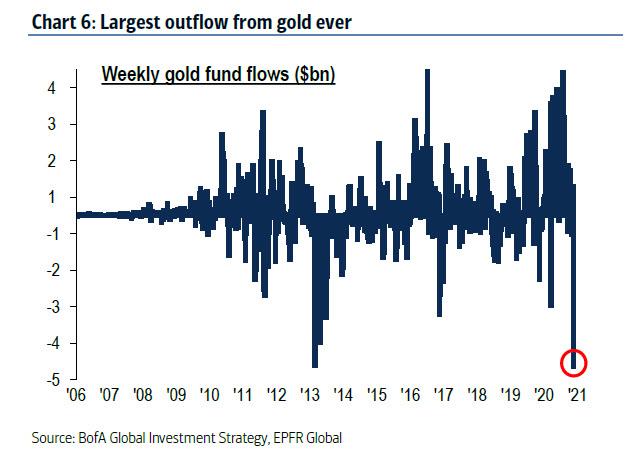
Likewise, fund flows prove speculators are inebriated by the hallucinogenic "stimulus" drug. On the one hand, investors have never piled up this much long positions of global equities, by a fairly big margin. On the other hand, investors are abandoning the gold ship - I guess because gold does not float - at a record pace before it sinks. Although the Eurodollar system must be sighing in relief, in view of the gold demand being inversely related with the confidence in the monetary regime, investors are going to find out that they have made a monumental mistake for the ship is of the space kind.
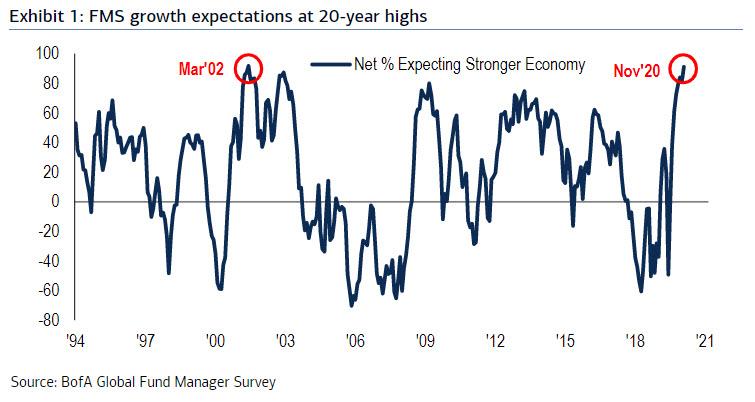
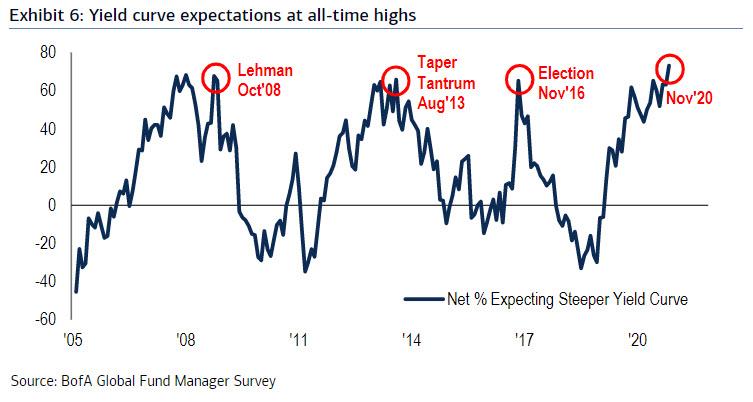
Recalling what I stated on the last instalment of this series, "there has to be more than hope and wishful thinking so as to have the much-anticipated reflationary recovery". Notwithstanding, investors are easily duped by the technocratic scientism. Thus, the FMS is indicating that investors' growth expectations are at levels not seen since the middle of the dotcom bubble. To top this accomplishment, expectations for the slope of the yield curve have never been greater. Unfortunately for investors, both of these bode poorly for stockholders.
In spite of seeming to be under the influence, the explanation for the rally may be far simpler. Perhaps, market participants are just being greedy. After all, as Milton Friedman said in an interview with Phil Donahue in 1979: "What is greed? Of course, none of us are greedy. It’s only the other fellow that’s greedy". However, they appear, instead, to be following Gordon Gekko's mantra: "Greed is good. Greed is right". 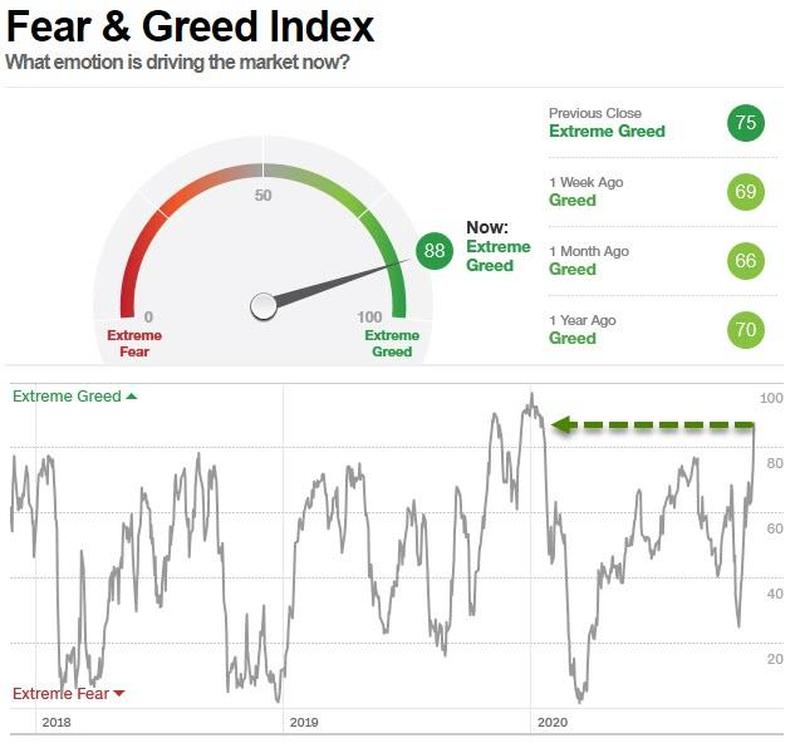 Finally, let's take a look at the Bloomberg’s Smart Money Flow Index, which is a measure of how "smart money" is positioning itself in the S&P 500. The logic behind the index is that smart investors tend to trade near the end of the day, while more emotional-based traders dominate activity in the first 30 minutes of the trading day. Having said this, the index is calculated as follows: yesterday index level minus the opening gain or loss plus the change in the last hour. As shown below, the Smart Index and the S&P were well correlated until late August. Since then, as highlighted by the red arrow, they have diverged sharply. Therefore, it ought to be expected they will converge in time. In addition, the light blue circle shows they also diverged, albeit to a much lesser extent, in January and February as the smart money correctly sensed problems. Curiously, even though since late August the early bird has been catching the worms, these (the worms) are getting wiped out, resulting in the demise of the "dumb money". As a matter of fact, those patient investors, who are led by the macro data and financial conditions in lieu of the "stimulus" and vaccine hype, are ultimately going to be proven correct, feeding on these stupid birds' carcasses, kind of like vultures do - just to maintain the bird analogy. 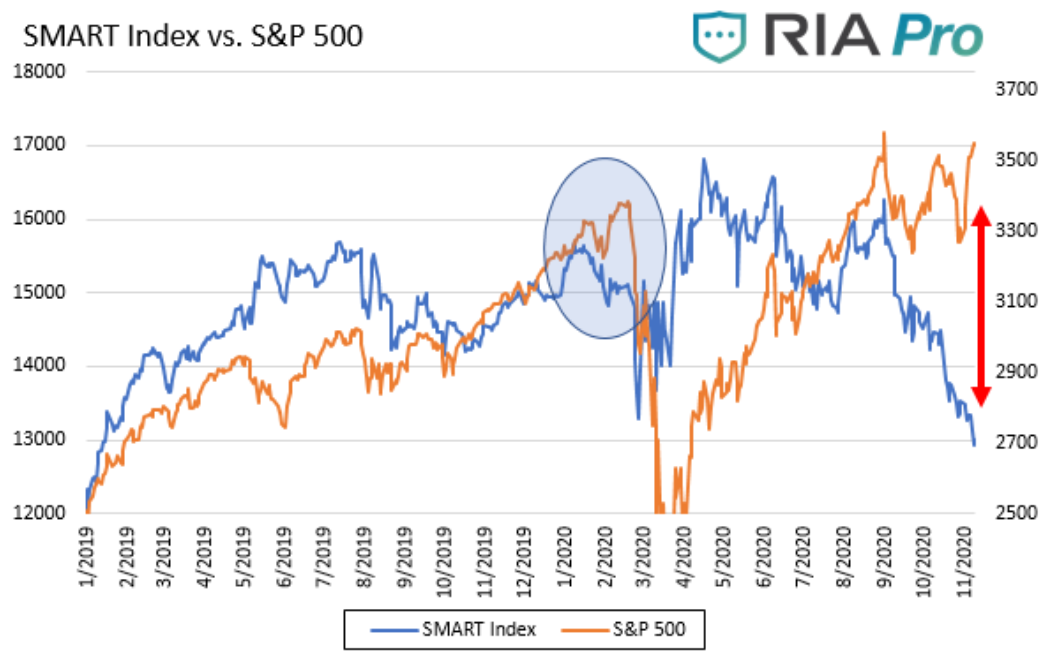 In conclusion, last week, Atlanta Fed President Raphael Bostic said on CNBC, on Tuesday 17, "the vaccine is definitely positive news and it will definitely lead to a pretty robust recovery once it gets into the population deep enough". Then, he followed this by claiming "[the Fed is] going to be paying really close attention to the numbers moving forward to see whether this weakness in retail sales translates into something more deep".
Despite nobody taking this pronouncement for what they are, this is an admission about the Fed's prospects on the economy. Indeed, Bostic inadvertently acknowledged the economy is not recovering and, to add insult to injury, it is rolling over, as retail sales figures are ostensibly implying. As a result, once investors come out from their heroin-like reflation euphoria trip, the hangover is certainly going to be brutal. Hopefully, no baby is going to die from neglect, although doom and despair will abound.
0 Comments
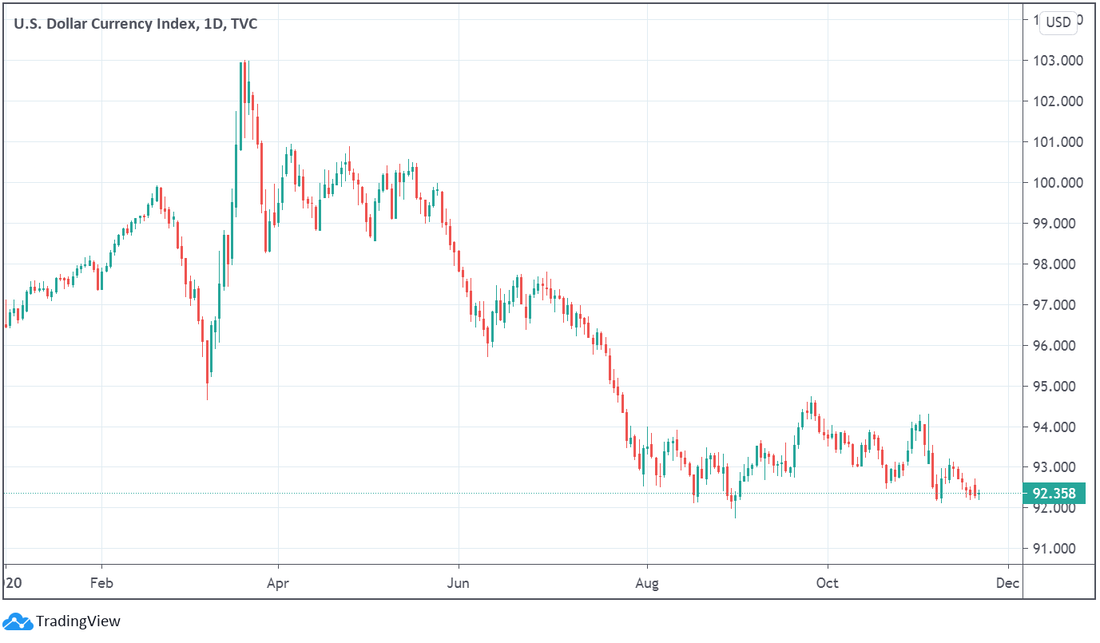
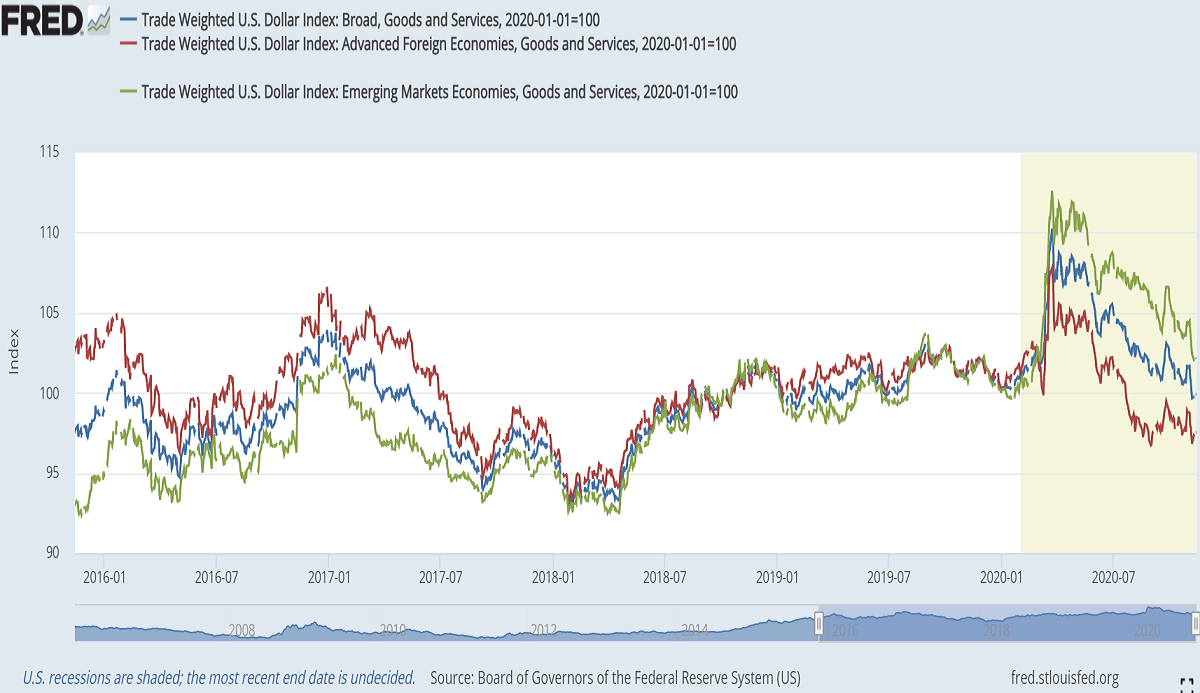
On Thursday, November 19, the markets were hit, after markets' close, by the announcement made by the Secretary of the Treasury, Steve Mnuchin, most of the lending programmes created during the March meltdown were not being prolonged, meaning that these are going to expire on December 31. According to Mnuchin, "[w]hile portions of economy are still severely impacted and in need of additional support, financial conditions have responded and the use of these facilities has been limited". In fact, the programmes together came nowhere close to their capacity of more than $4.5 trillion, made available by $454 billion funding from the CARES Act. Believe it or not, the Fed only used roughly $25 billion of those funds. Albeit having a negative response, the markets seemed to be indifferent to this declaration. In the realm of stocks, even though it budged 200 points on the news, the Dow Jones, along with the other main indices, is still on an upward path. The Fed, au contraire, is at odds with the Treasury. "The Federal Reserve would prefer that the full suite of emergency facilities established during the coronavirus pandemic continue to serve their important role as a backstop for our still-strained and vulnerable economy", claimed the central bank. Curiously, this denotes a more meaningful discord in the way these two entities assess the state and trajectory of the economy and the financial conditions. While the Treasury is feeling sanguine on the recovery, the Fed has been apprehensive, to be generous, after having gone through some soul-searching - this topic demands a post or more on its own. Accordingly, Jay Powell and other members of the FOMC have been expressing their concerns about the health of the economy, having even gone to Congress to call for more stimulus: "Further [economic] support is likely to be needed to avoid further spread of the virus and help individuals who, with the expiration of the CARES Act payments, are seeing their savings dwindle". The FOMC, in its official statement, reasoned their stance by claiming that "the economy will depend significantly on the course of the virus" and that the kung-flu crisis - more like the paranoia around it - "will continue to weigh on economic activity, employment, and inflation in the near term, and poses considerable risks to the economic outlook". Nevertheless, the financial markets, which are today's matter of discussion, are ostensibly all on the Treasury team, but one. Having read the first two instalments of this series, you should have no problem figuring out which market, or market category, is the outlier. Unsurprisingly, the sovereign bond markets, represented here by the 10-year JGB (blue), bund (red) and UST, are implying what the market-based inflation indicators (breakevens and swap spreads), and even the ZEW survey in Germany, have already shown us. As I have finished part two off by mentioning the rebound left its mark on two points in time. To wit, the beginning of June was the first and the second lie at the end of August and the dawn of September. By the same token that Germany and Japan act as bellwethers for the global economy, their own government bonds seem to act like one as well. The UST, though, is on la-la land. However, it did not start out this way. On June 5, all of these three markets realised the economy comeback was losing some steam. Up until early August, they were signaling a slowdown, especially the UST. Then, in spite of financial conditions apparently beginning to get looser till the end of that month, the 27th, they once again recognised deflation, or disinflation at best, was the economy's fate. Interestingly, by the time October arrived, the UST inaugurated a decoupling from the other two, by and large compared to the bund, despite the vaccine breakthrough making the impression that they were going to move together to the good side, upwardly. Although it now seems they are on the same path, it is unfortunately on the bad, downwards one. 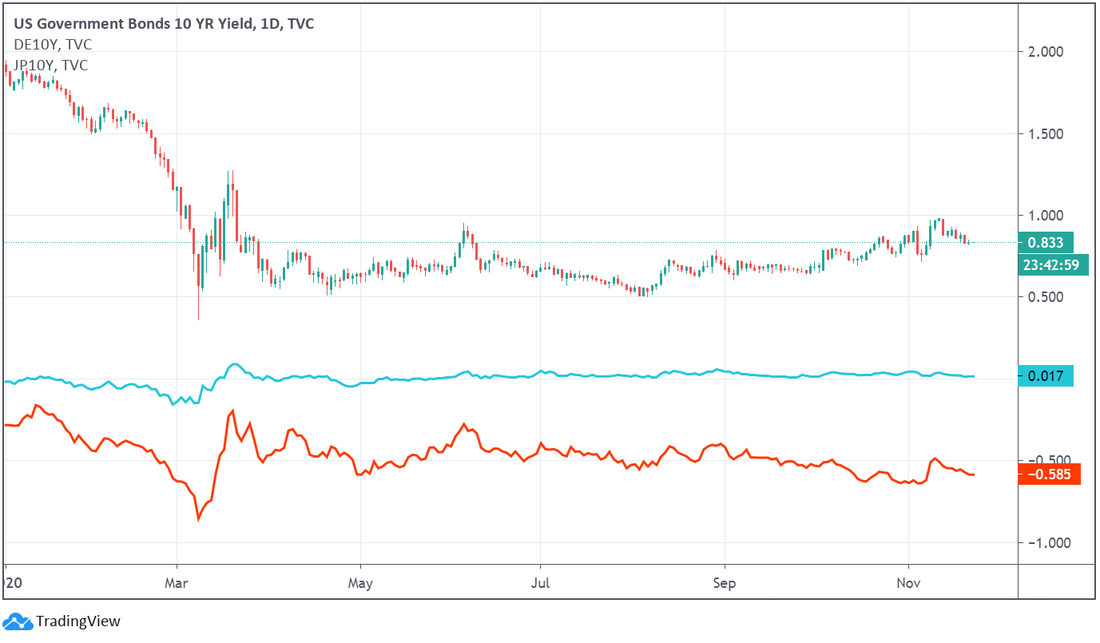 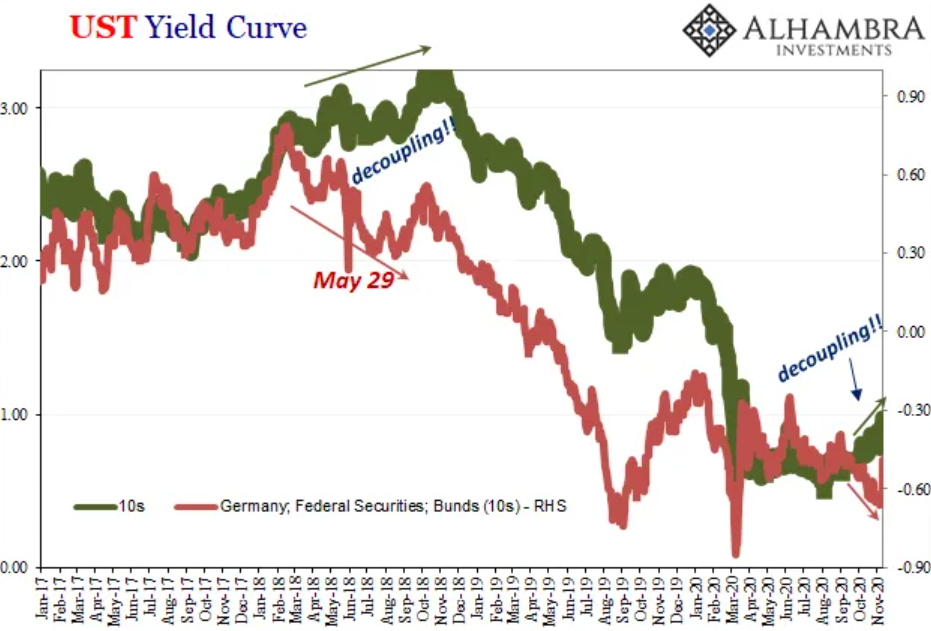 As the graph above shows, this oddity had teased the decoupling cheerleaders from May 2018 up to late October/early November. Owing to participating in a global economy, with its foundations on a border-less monetary system, every country or bloc, sooner or later, feels the monetary drought or bonanza of the eurodollar system, making the decoupling an absolute fantasy. In the same way that the last one lasted around 5 months, this one will most likely be as or even more ephemeral. Granted that this one is currently approaching its third month, because of all of the data exposed in this series I am inclined to believe the decoupling mirage has already vanished. Moving on to another market indicator of the economic panorama, as well as probably reflecting most accurately the level of economic activity, the oil market tells the exact same story as the bond market. Once restrictions were lifted as April came to an end and May kicked off, prices soared (resembling the right side of the "V" - hurray!) until June 5, rising languidly till August 26 (which happens to be the day before the 2020 Jackson Hole Economic Policy Symposium commenced). Afterwards, oil prices embarked on a downward course until the eve of the Election (Fraud) Day, November 2, when it returned once more to the bullish mode driven by Sleepy Joe's alleged victory and then getting hit by the vaccine news the following Monday. Clearly, the effect of this factor duo is still lasting to this day in the oil market... 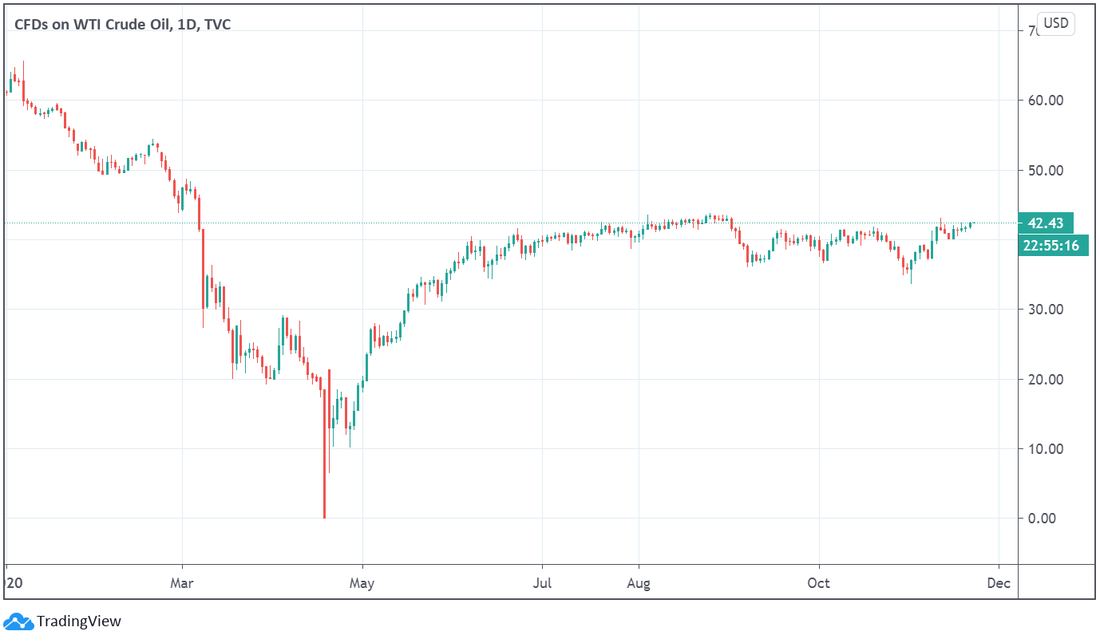 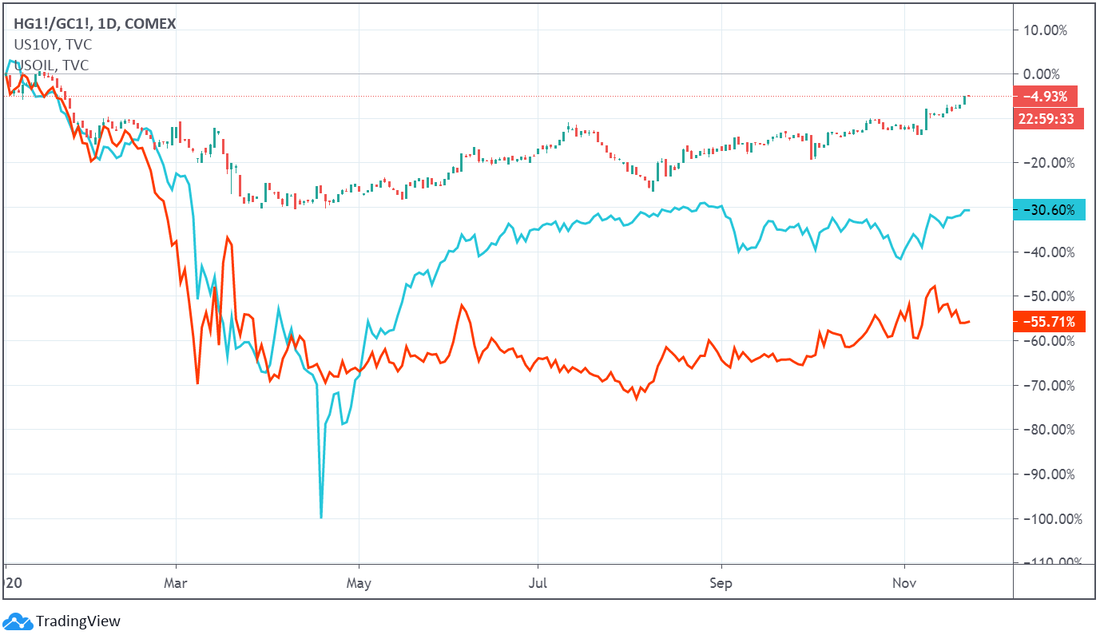 ...in addition to the rest of the commodities domain. Above, it is depicted the 10-year Treasury yield (red), the WTI oil (blue) and the copper-to-gold ratio normalised to December 31 of 2019. Looking at the chart above, it is obvious the copper-to-gold ratio is significantly diverged from the 10-year UST, even more so than oil is. It resembles what was occurring in July when the two were going in opposite direction. Despite that, he ratio then started to follow the bond yield. In view of Treasury securities being the adults in the room, this ratio and oil too will certainly tread on the heels of the 10-year Treasury. Furthermore, the dollar, either via the DXY or the trade-weighted indexes, is suggesting the rebound has hit a wall since the onset of September, and neither the anointed President nor the vaccine news were able to convince market participants that reflation is on the cards. Just to keep the consistency, indulge me one more time. Firstly, financial woes eased rapidly, when lockdowns were put to an end in May, until June 10, having the dollar distress returned again at the Q2 quarter-end bottleneck. Secondly, after that seasonal phenomenon, the dollar resumed its decline till September 1, having since traded sideways.
Finally, turning our attention to the market that everyone pays attention to, there are no reasons to be chirpy. Obviously, I am referring to the stock market, not just in the US, but in the world as a whole. Be that as it may, let us first focus on the States. On the graph below, the main American stock indices are pictured: the Dow Jones (blue), the Nasdaq 100 (red), the Russell 2000 (yellow) and, the main feature, the S&P 500. Once again, and I hope this does not bore you (so I will save the details for you to do), these indices are demonstrating the reflation optimism exhausted completely by the arrival of September. Notwithstanding, after dropping gently up to the day "the most extensive and inclusive voter fraud organization in the history of American politics" took place, stocks have had a big-stimulus-hope-plus-vaccine-news-induced rally. As you can see, the small caps (Russell) have been the highlight. Due to the development of the vaccines, market participants are expecting life to go to normal - the old mask-free, less totalitarian and insane one. Hence, there has been a rotation from the stay-at-home trade to the reopening one, which results in getting rid of some tech stocks (Nasdaq) and, in turn, acquiring pretty much every other group of stocks. Therefore, it should surprise nobody the Russell 2000 has reached a new record high, with the Dow Jones being on the verge of reaching the 30,000 points landmark. 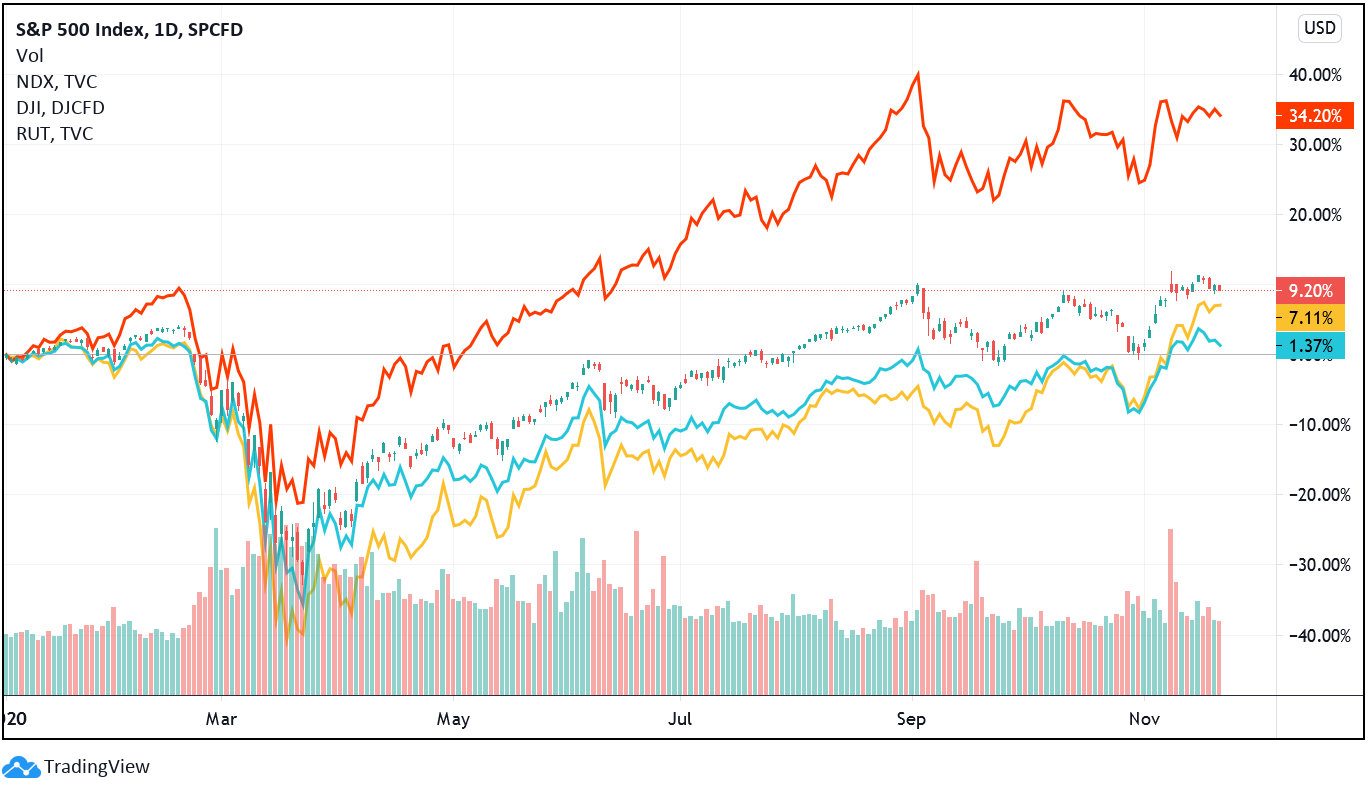 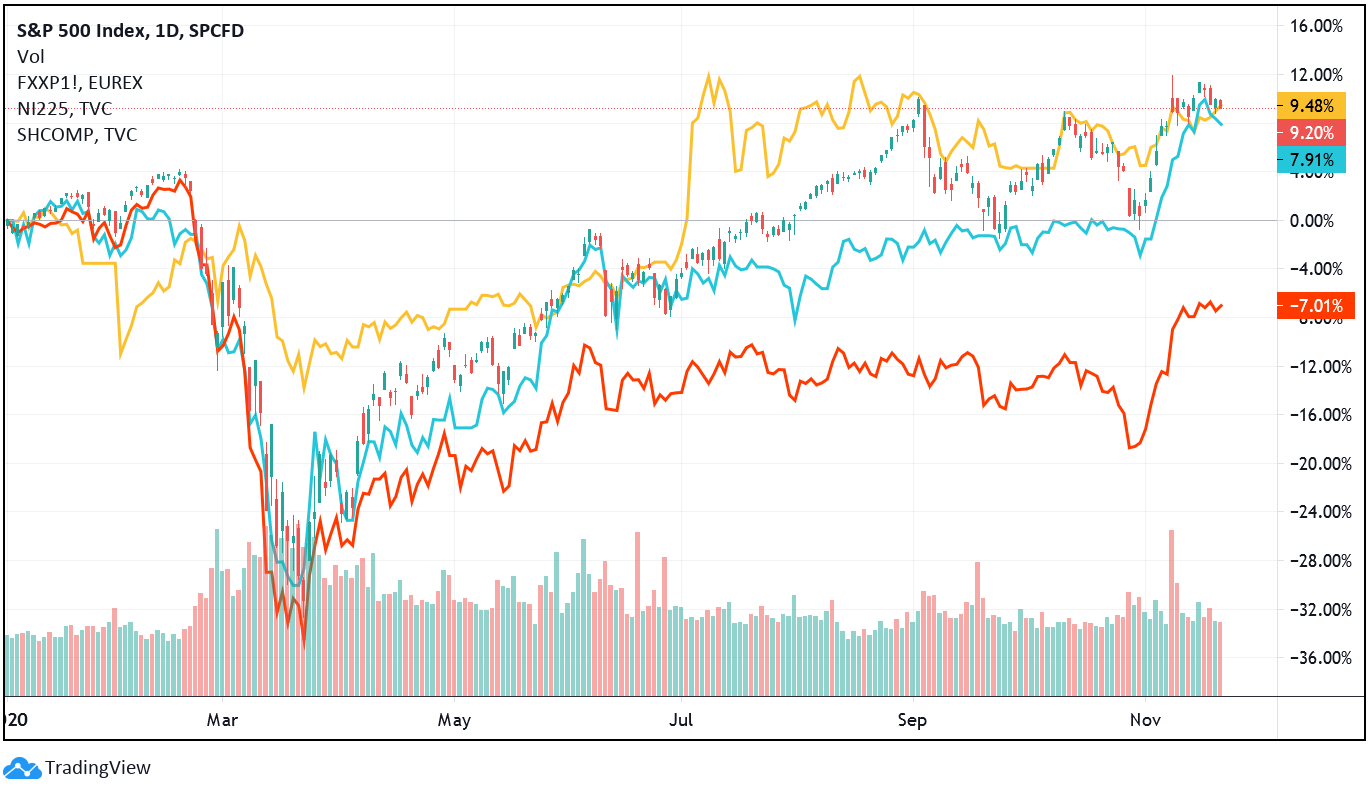 Reviving the countries/regions featured on the previous chapters, the US, Europe, China and Japan, let's take a look at the performance of their stock markets. On the chart above, for the US we have the S&P 500, for Europe we have the STOXX Europe 600 futures (red), for China we have the Shanghai Composite (yellow) and for Japan we have the Nikkei 225 (blue). Starting on the Far-East, from June to November 3, the Nikkei traded sideways on a very tight range, shooting up thereafter. Similarly, the Shanghai Composite climbed till July and has remained at the same level since. On Europe, however, the prospects have been even bleaker than in Japan, with the Biden-Pfizer-Moderna combo saving the European stocks from further decline, though the broad market is still very much negative so far this year. Moreover, breaking the global stock market down in three regions, the US, DM excluding the US and the EM. For the US we have the Russell 3000 - it is a market-capitalisation-weighted equity index that tracks the performance of the 3,000 largest U.S.-traded stocks and serves as a building block for a broad range of financial products which include the large-cap Russell 1000 and the small-cap Russell 2000 index -, for the DM ex-US we have the Vanguard FTSE Developed Markets ETF (red) - it tracks a market-cap weighted index of large-, mid- and small-cap stocks from developed markets outside the US; 3,977 in holdings -, and for the EM we have the iShares MSCI Emerging Markets ETF (blue) - it seeks to track the investment results of an index composed of large- and mid-cap emerging market equities; 1,212 in holdings. As before, European stocks, which make out the big majority of the this ETF, was obviously saved by all of the recent developments. In spite of turning positive for the year, it is still far from the US and the EM bloc (of which China has a huge influence). 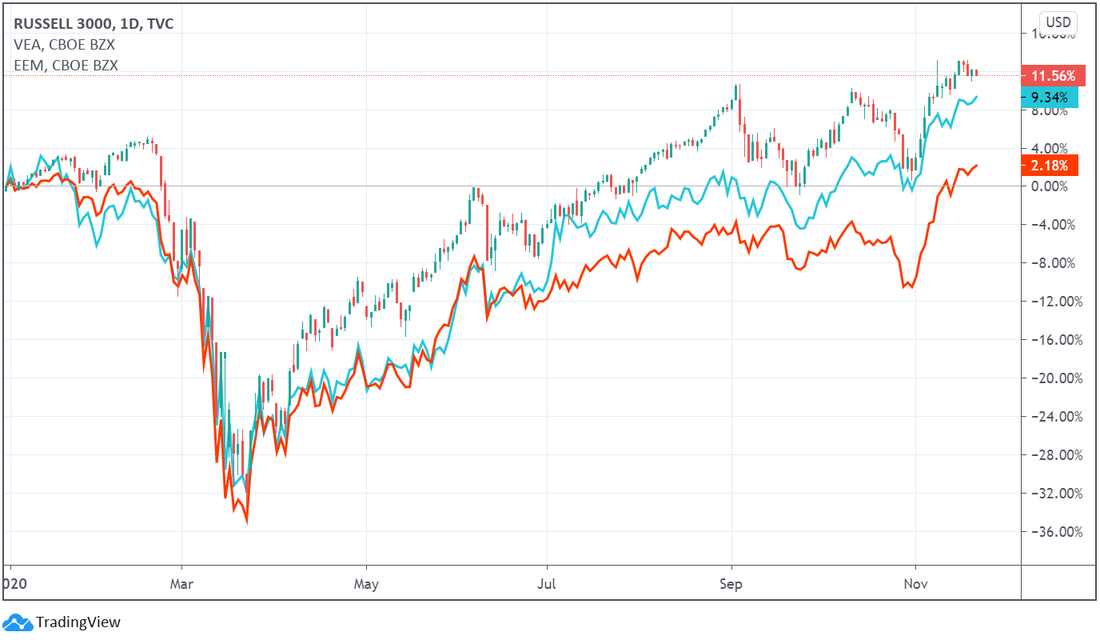 To conclude, the only question left to answer is whether or not this recent optimism, or euphoria rather, is justified. Unfortunately for the economy and the financial markets, there has to be more than hope and wishful thinking so as to have the much-anticipated reflationary recovery.
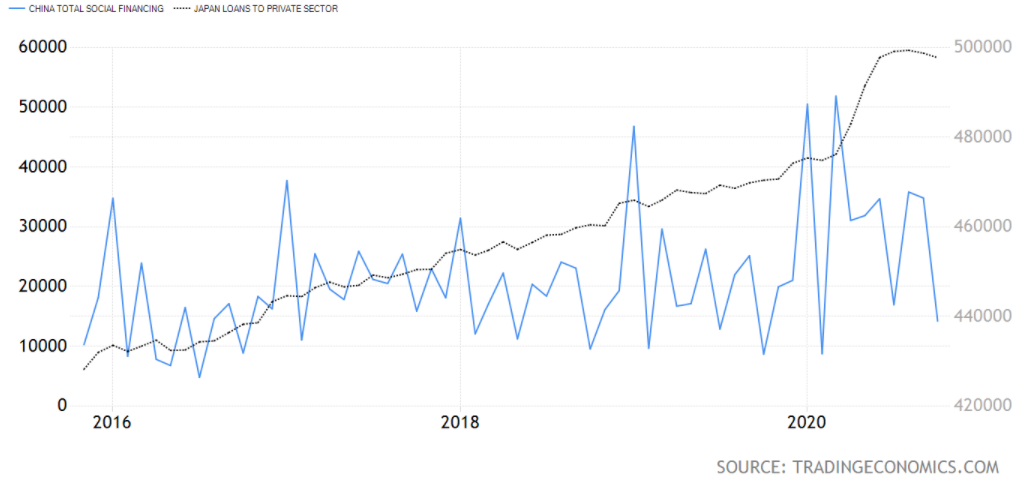
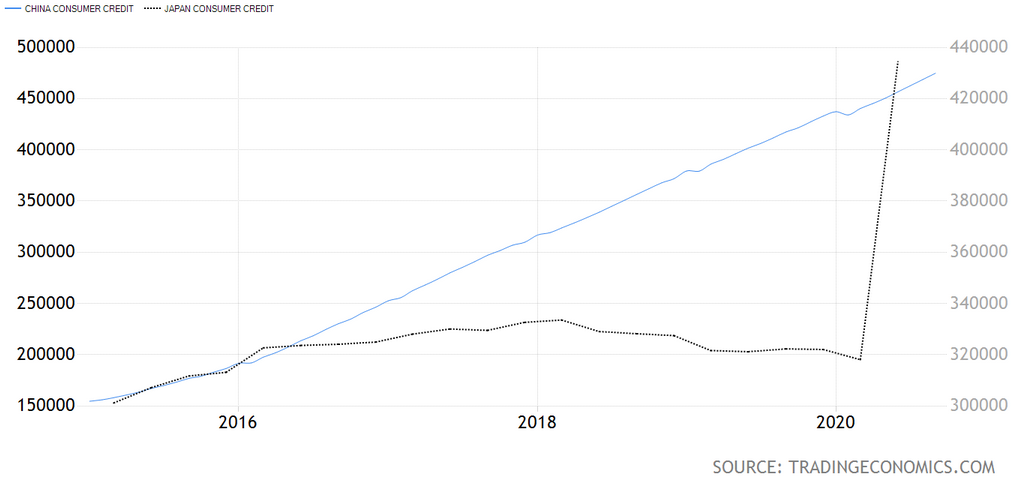
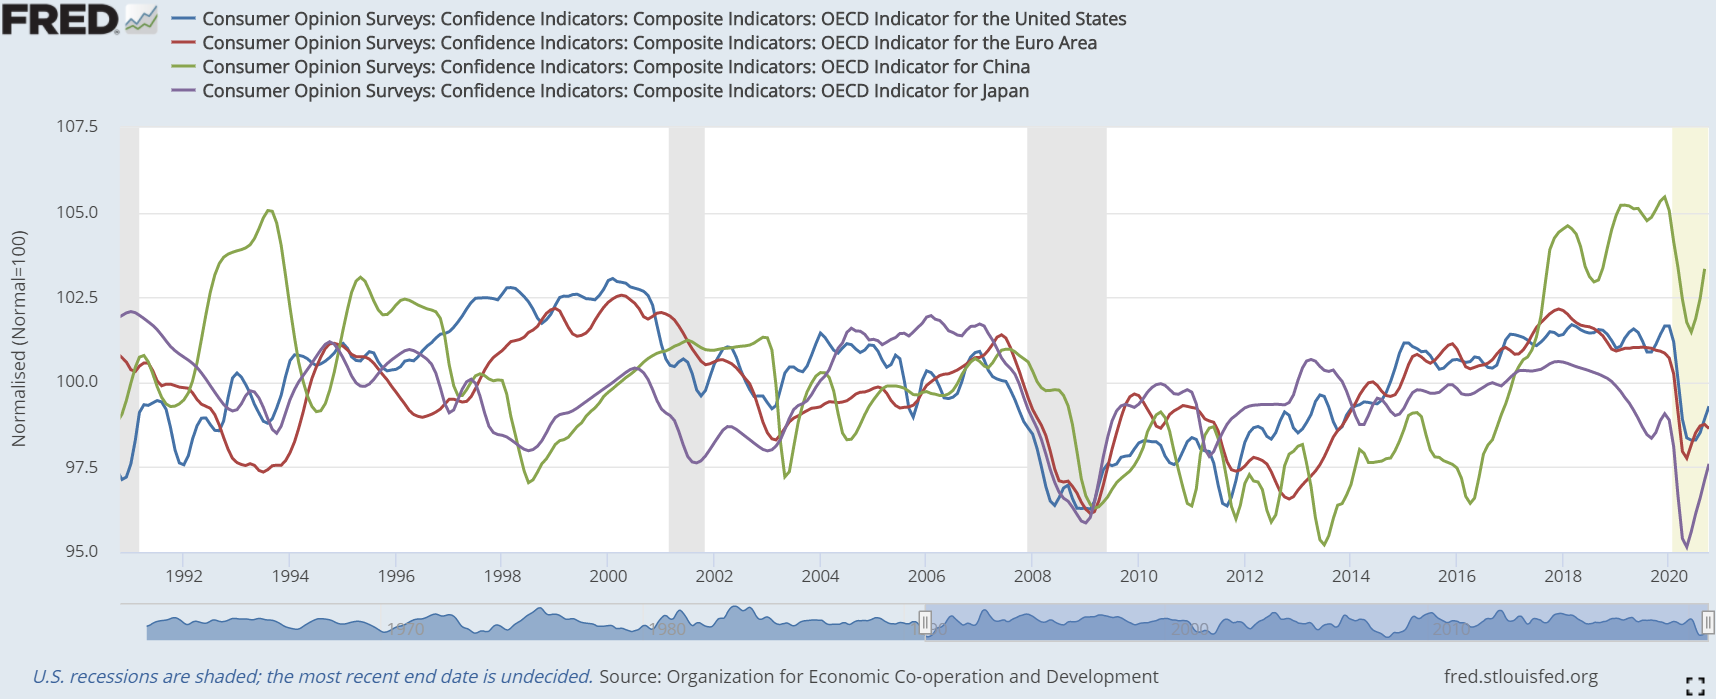
When bearing in mind all of the recent bullish developments, the US election results and the vaccines, it is no surprise there has been this rotation towards the reflation trade. Of course, one would only assume this if he is guided by faith in the governments' and central banks' stimulus fairytales, plus the hype and reassurance coming from the financial press and "gurus", and would have to ignore everything else I showed here in addition to the roadblocks that are fast-approaching, like the expiration of the moratoriums and of the federal jobless compensation schemes. Which market do you think is more reliable? That historically has been more on the money (or lack of it)? Undoubtedly, the bond market, either the UST or the bund, is the more truthful. Regardless of the present stock market inebriation, they will ultimately join the bond's monetary hangover. Resuming this three-part series about the health of the economy and the power of the vaccine plus stimuli combo to keep the boom alive, I am going to pick up where we left off on the first segment, exploring some macro data. As a reminder, part one concluded with the business and consumer confidence surveys for the featured geographies, namely the US, the EA, China and Japan. Despite shooting up from their March bottom, these sentiment surveys were pointing out the rebound was losing momentum. To add insult to injury, European consumers' confidence has turned more pessimistic since the end of summer. In view of the fact Germany has been a harbinger for the global economy, since at least the GFC, its ZEW figures are hinting at alarming prospects. All the same, is there any real reason to doubt the reflation story? After all, governments and central banks around the world are doing more than ever before to prop up their economies. As I claimed at the conclusion of part one, "the amount of optimistic figures are very scarce and becoming even more so as time goes on". Hence, it is now time to present the more dreadful data which happen to paint a more realistic picture of the state of the (global) economy. Because the monetary (eurodollar) system is a debt-based one, in order for the economy to keep on expanding, the money supply must inflate equally, either through government debt or bank credit. As you ought to already know, the original definition of inflation is the expansion of the money supply. However, this definition was gradually lost. Instead, the currently established definition is a general rise in prices. Although that is the case, as Milton Friedman put it, "inflation is always and everywhere a monetary phenomenon". Therefore, an increase of the money supply begets a general rise in prices. In any event, inflation brings about rather dreadful consequences. In spite of not being a necessary condition for economic growth, owing to the present monetary system being based on debt, soaring prices are an indication the economy is booming. Now that I have jogged your memory, let's look into the statistics. Across the board, the CPI figures have climbed from the March lows. Nevertheless, in China it has been dwindling since the end of last year, on account of pork supply and, consequently, price returning to normal levels after a serious outbreak of African swine fever (Rabobank estimated China lost up to 55% of its pig herd last year). With Europe, in addition to Japan, acting as forewarnings, and the US being a laggard, the lack of acceleration and even the falling prices, in the case of the EA, imply economic activity is rolling over. Be that as it may, a deeper dive into more data is on the way. 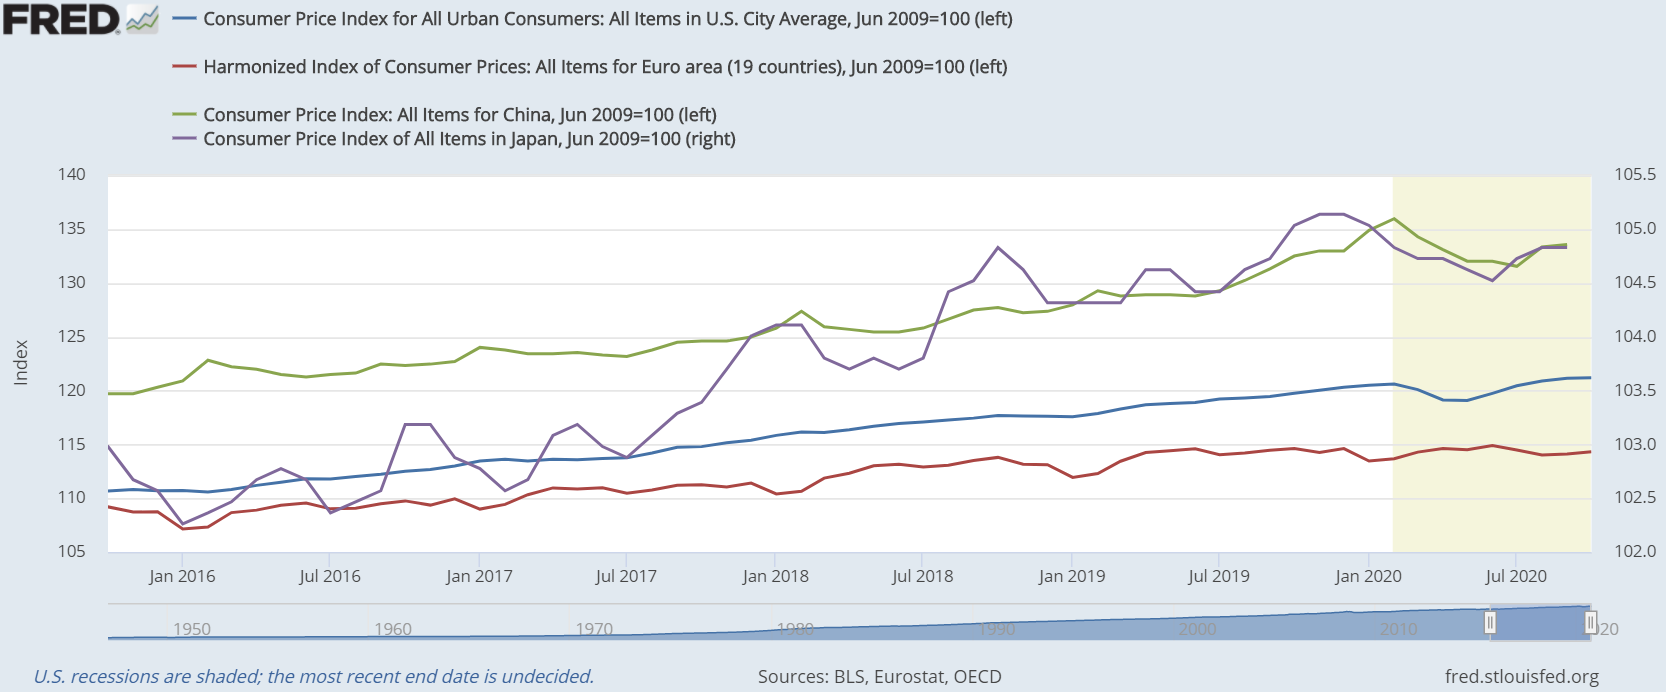 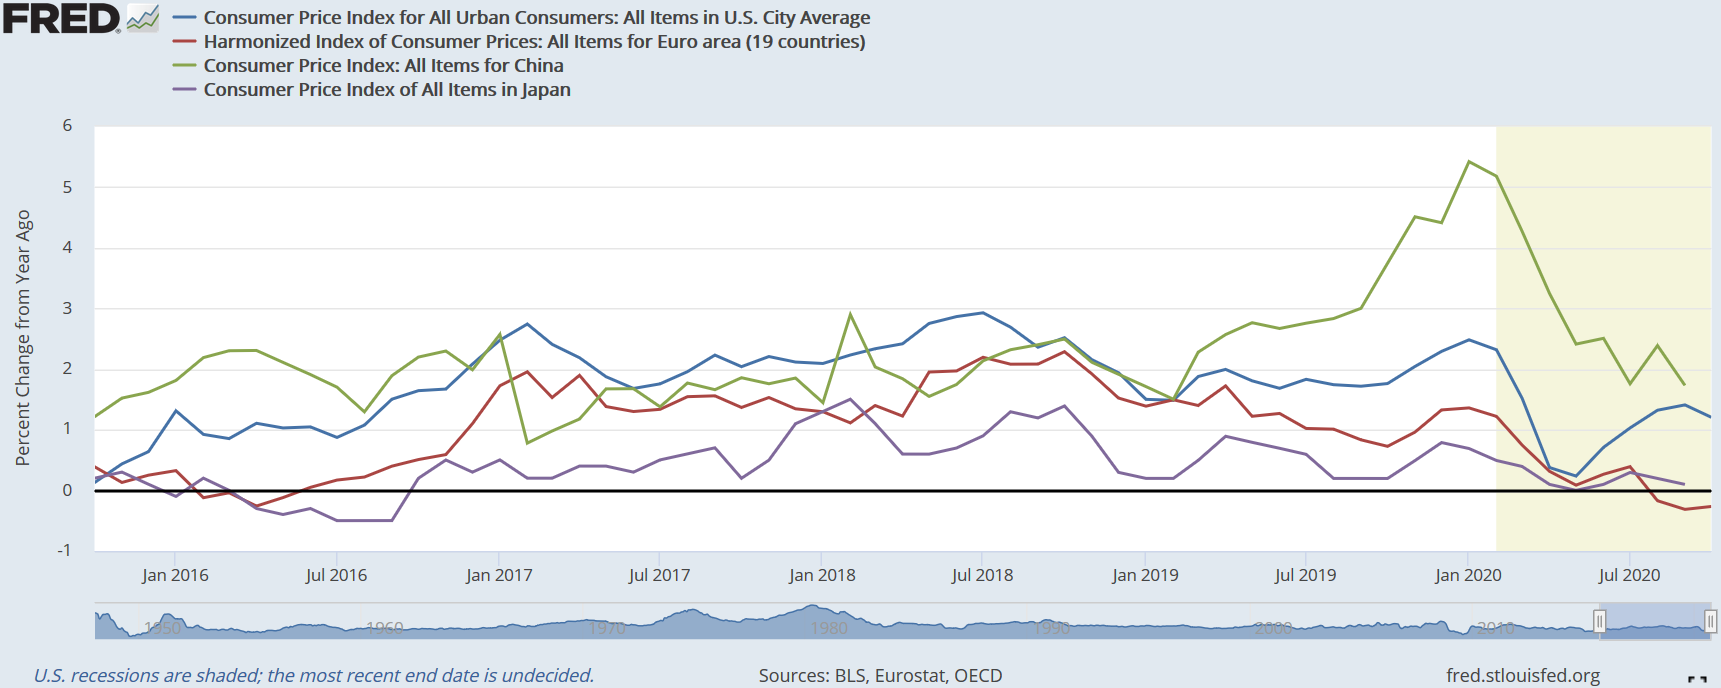 Focusing on the US, due to the easing of restrictions, companies began hiring some of the workers they had let go during the lockdowns. Unfortunetely, the number of openings is still fewer than the pre-covid era. Similarly, the amount of hires has not been enough to absorb the laid-off workers victimised by the hysteria, as the ADP payroll report below shows. To make matters worse, employment growth is dangerously stalling, especially in the industries most affected by the economic shutdown. Furthermore, that may explain why the labor force participation rate has remained subdued for a few months at very low levels, though after an initial rebound. Ergo, all of this measures up, not to the reflation - even less to the "V-shaped" recovery - narrative, but to the deflationary slowdown one. 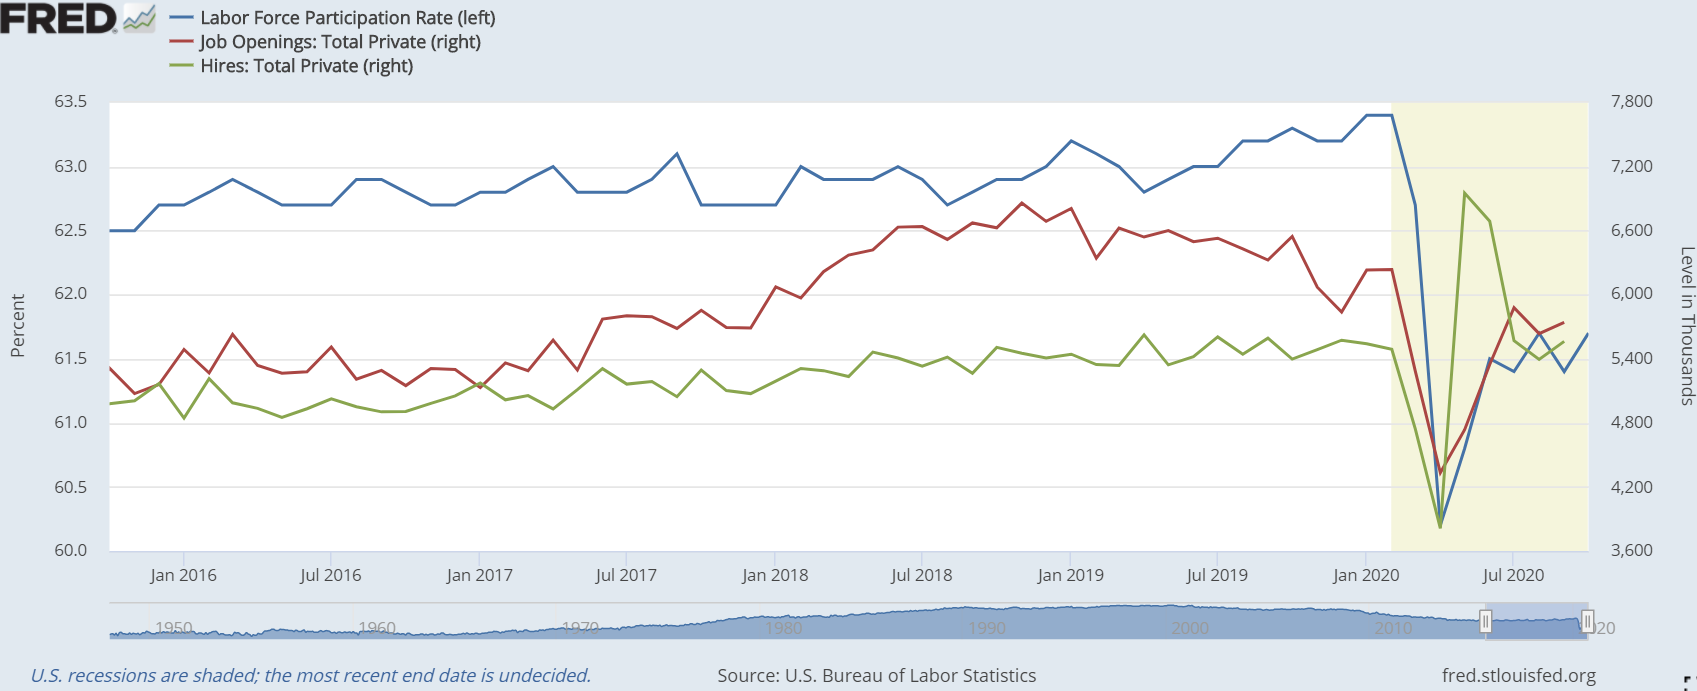 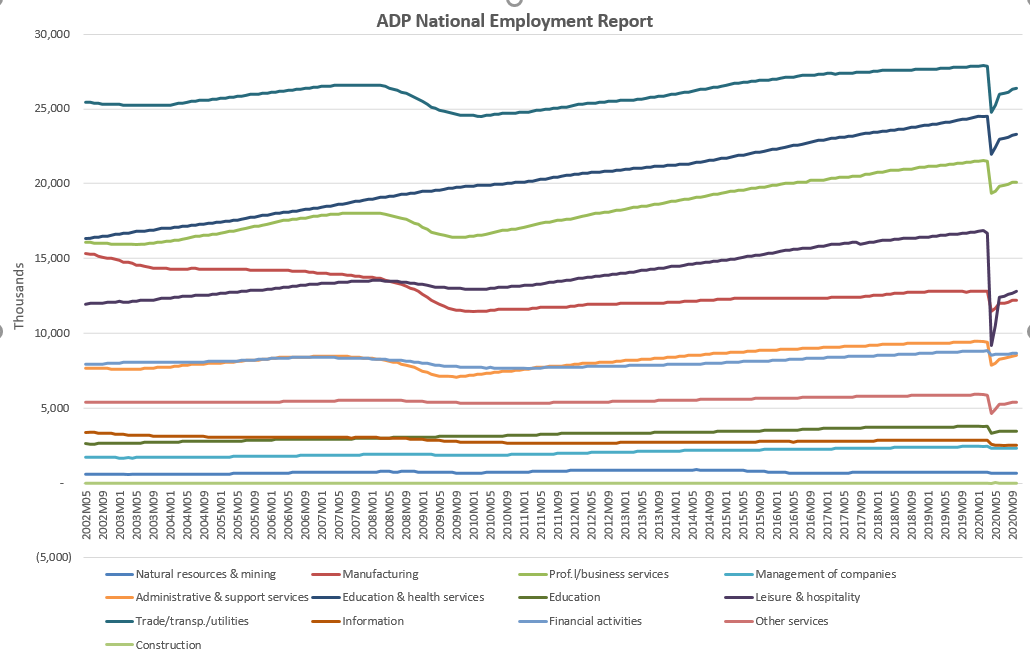 Evidently, so as to experience the much anticipated reflation, as I explained above, credit has to grow as a direct consequence. Curiously, credit creation has been somewhat disparate between the type of borrower, as well as between the East and the West. On the one hand, in America and Europe, loans aimed at businesses skyrocketed during the restrictions to compensate the plunge in revenues. Likewise, the same thing occurred in the Orient, though in China the spike peaked in February because they caught the lockdown fever in late January. Like I said on the post of October 24, "[t]hat surge at the beginning of the pandemic is explained by the rolling out of lines of credit directed to businesses in order to keep up with current expenses, such as salaries, rent, etc., by making up for the diminishing revenues. (...) Yet, this kind of loans plus real estate loans have joined the downward trend set by consumer loans, which has been decreasing since the kung-flu hysteria invaded the New World, especially credit cards and other revolving plans". On the other hand, credit directed towards consumption has been decreasing in both the States and Europe, while over in Asia it has been the complete opposite. In China, consumer credit continued swelling at the same pace as if nothing happened. Even more remarkable, the uptick in Japan has put this kind of credit at levels not seen for almost a decade. Notwithstanding, as I exposed on part one, this has not been enough to push retail sales to decade old highs, not even one year old highs. 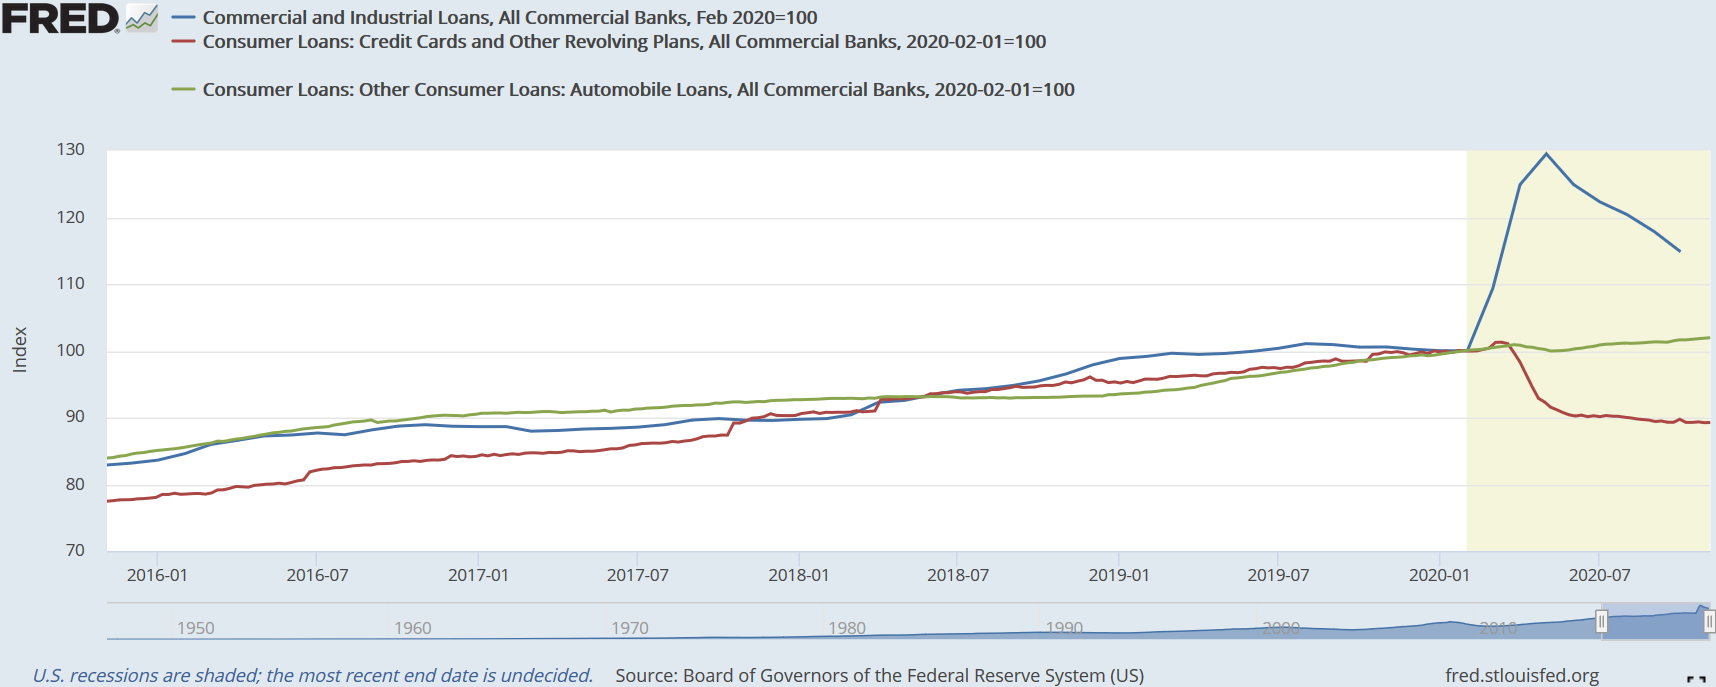 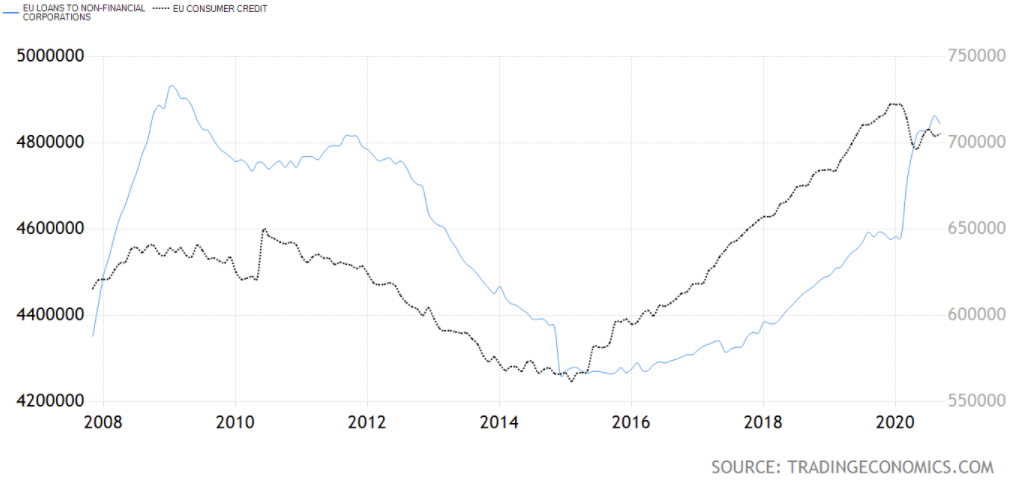
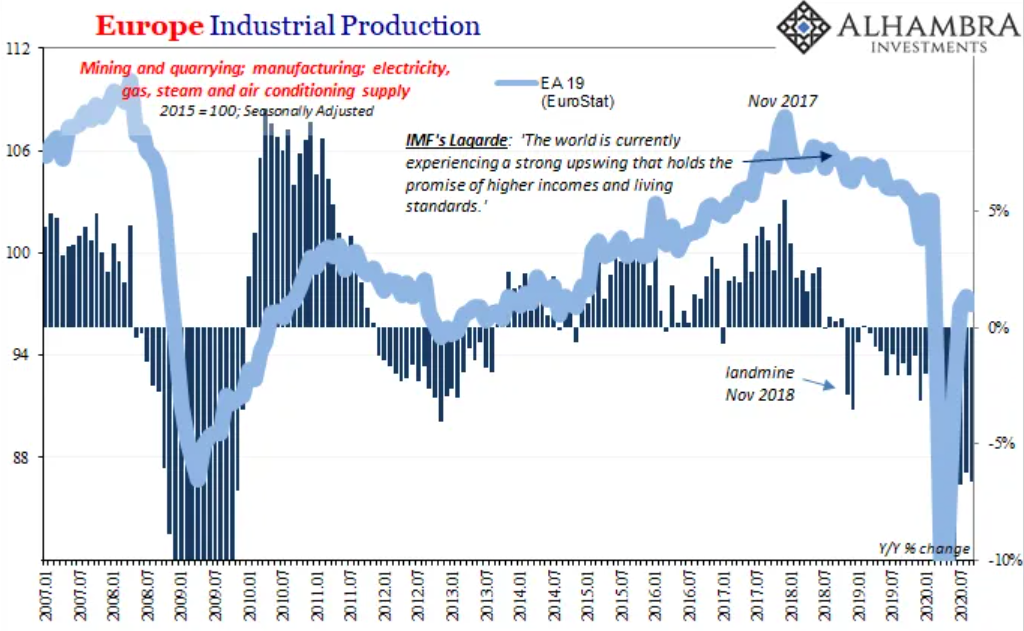
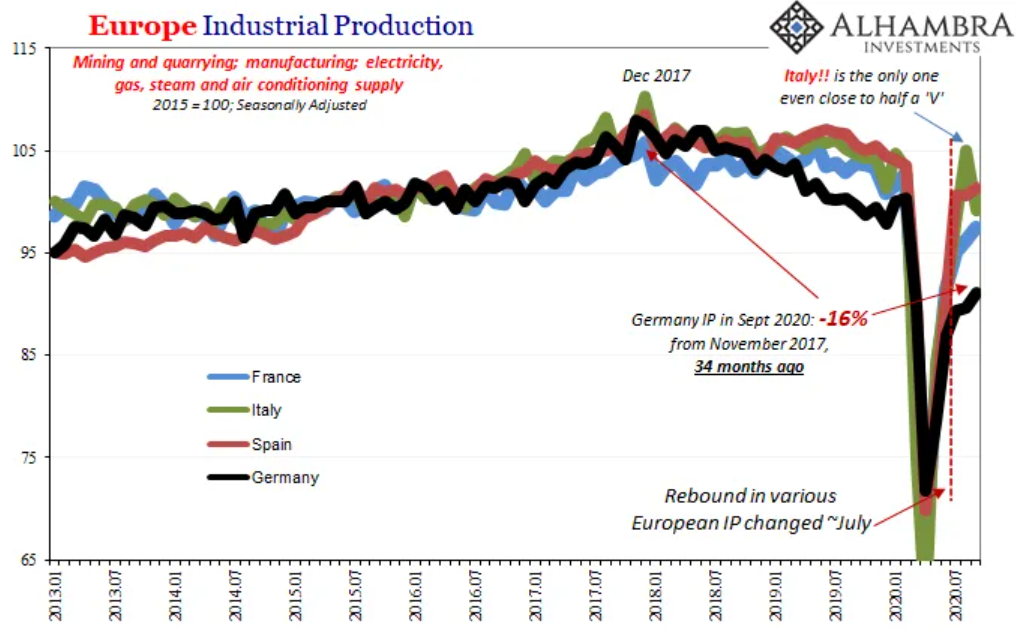
Insofar as banks are the true money creators, when they believe economic opportunities are proliferating more credit is originated by providing loans and other types of debt to consumers and businesses. Having said this, the surge in business borrowing has not spurred an equal amplification of the industrial production, having even come up short of tagging the level of 2019, which had notoriously failed to surpass the previous year's peak in all these countries - yes! including China. Once again, the fact that the IP comeback in Germany, which is a manufacturing powerhouse, is halting at such a low level speaks volumes about the state of future demand in the short-term. It goes without saying, this bodes terribly to the reflation cheerleaders in government buildings and financial centers across the globe, as well as in financial newsrooms. 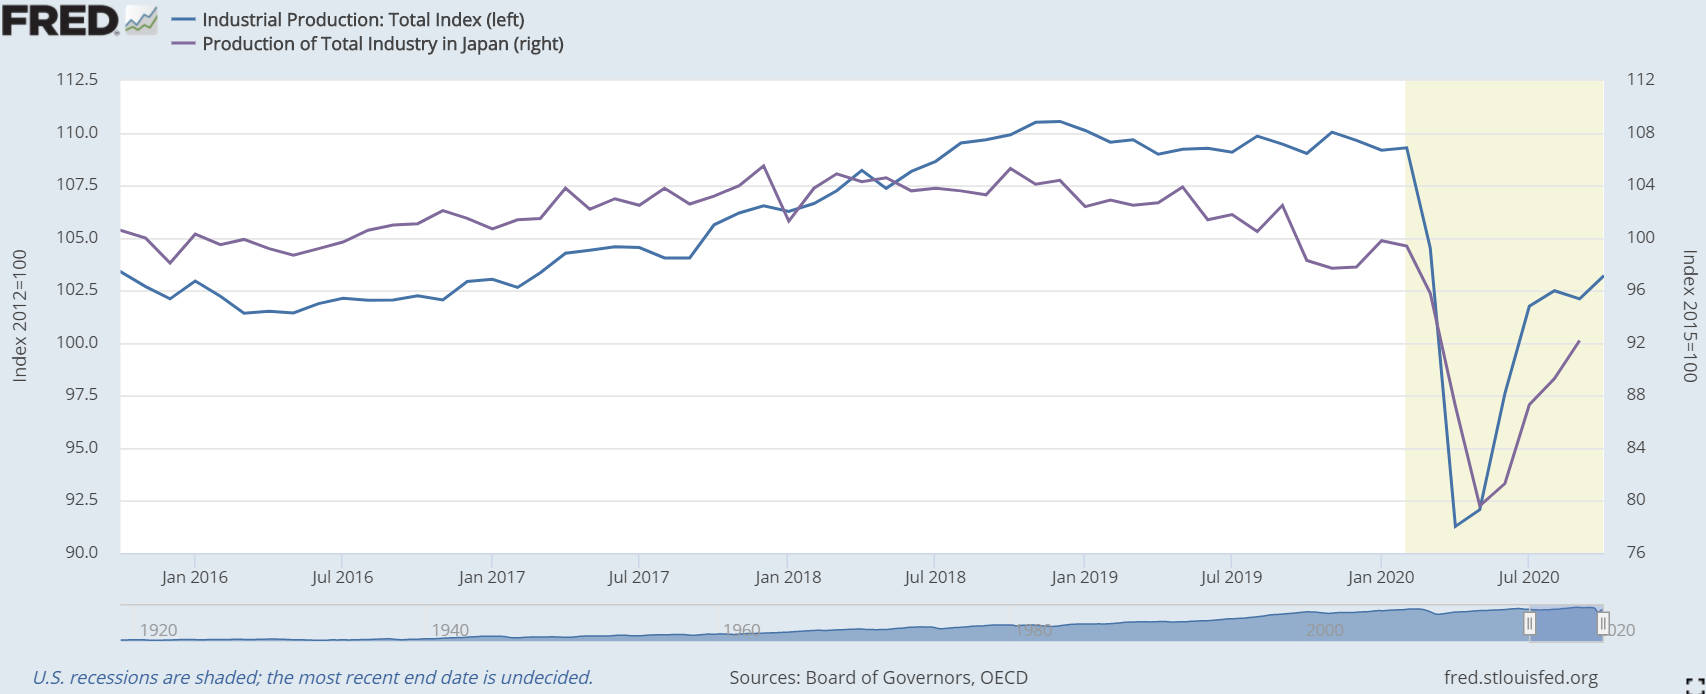
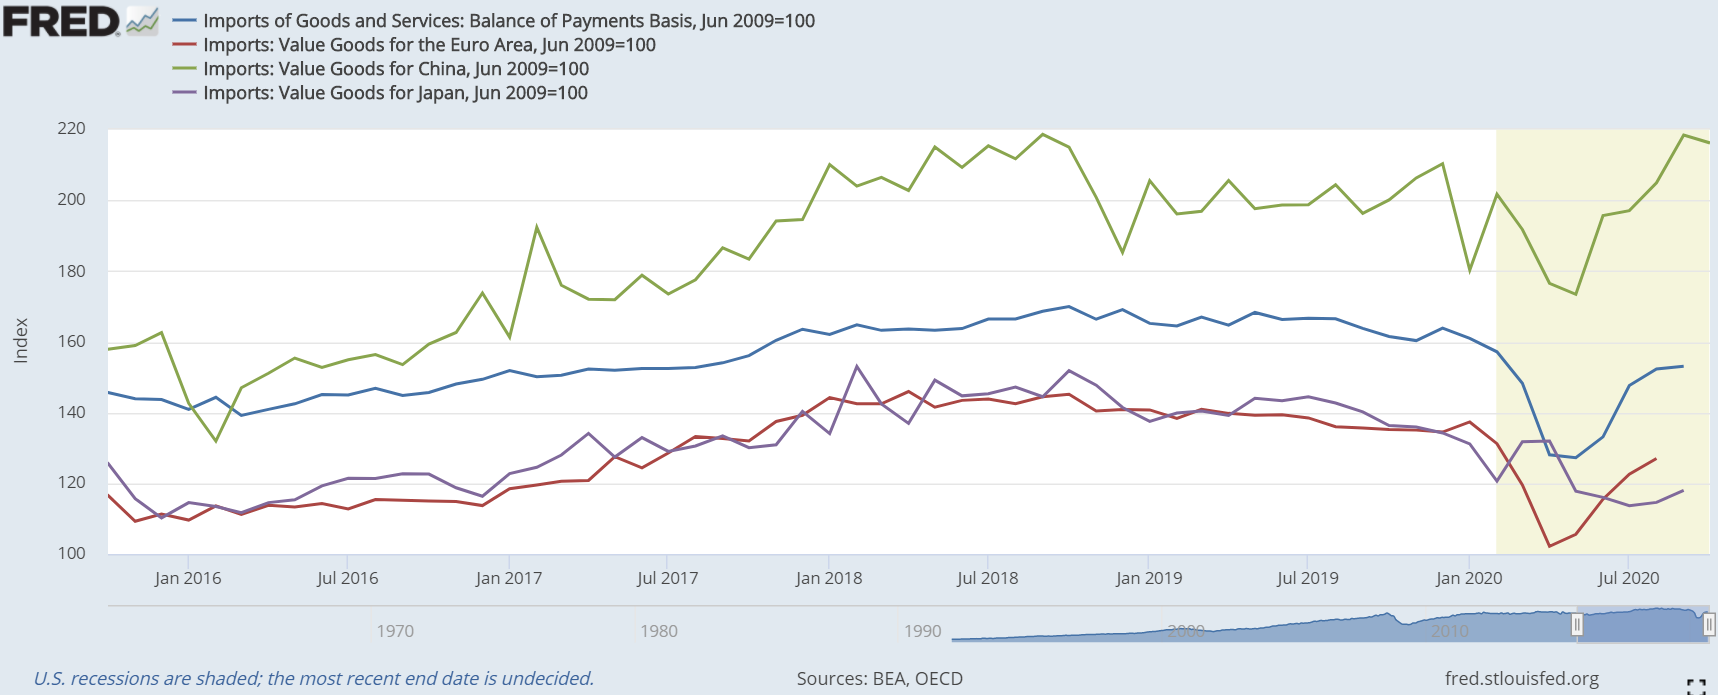
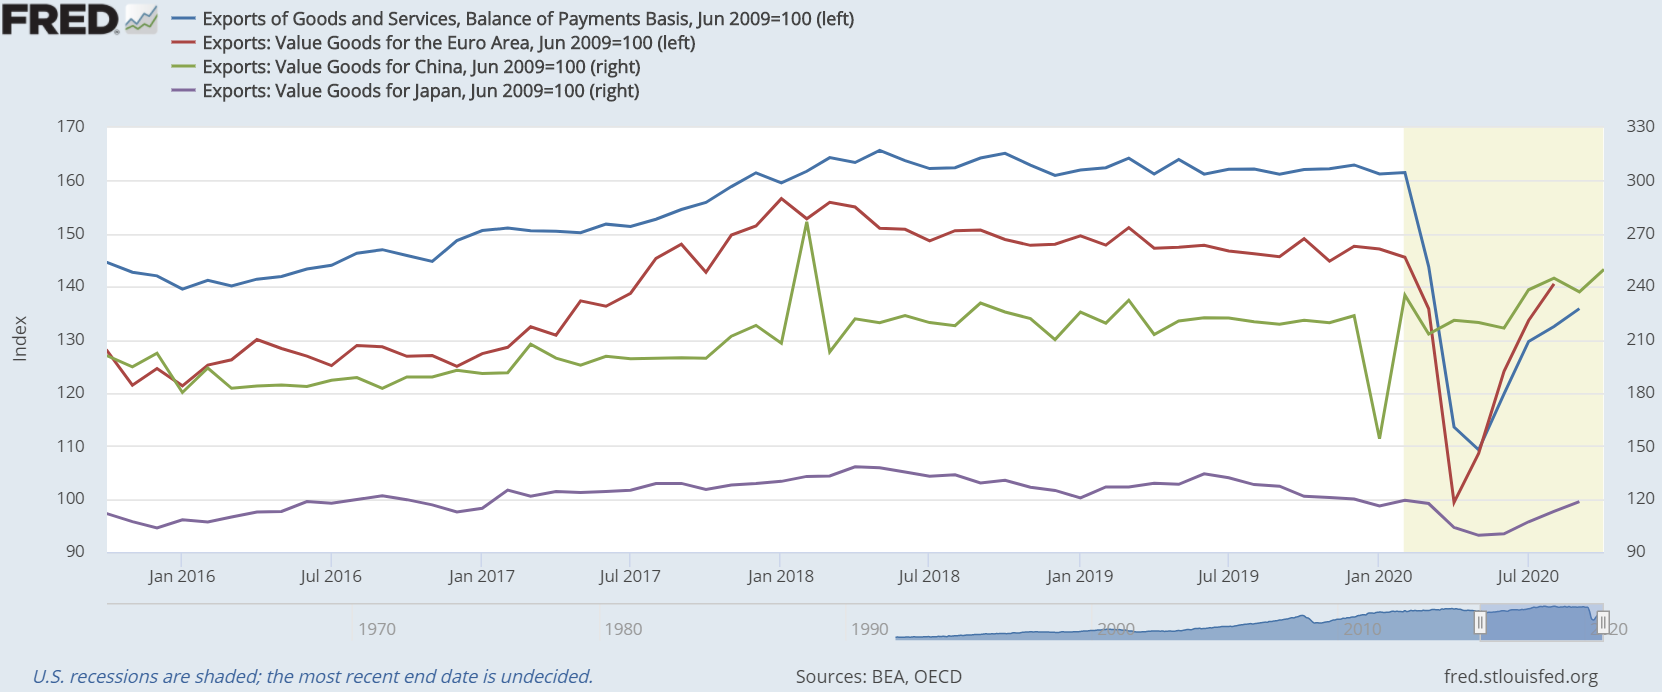
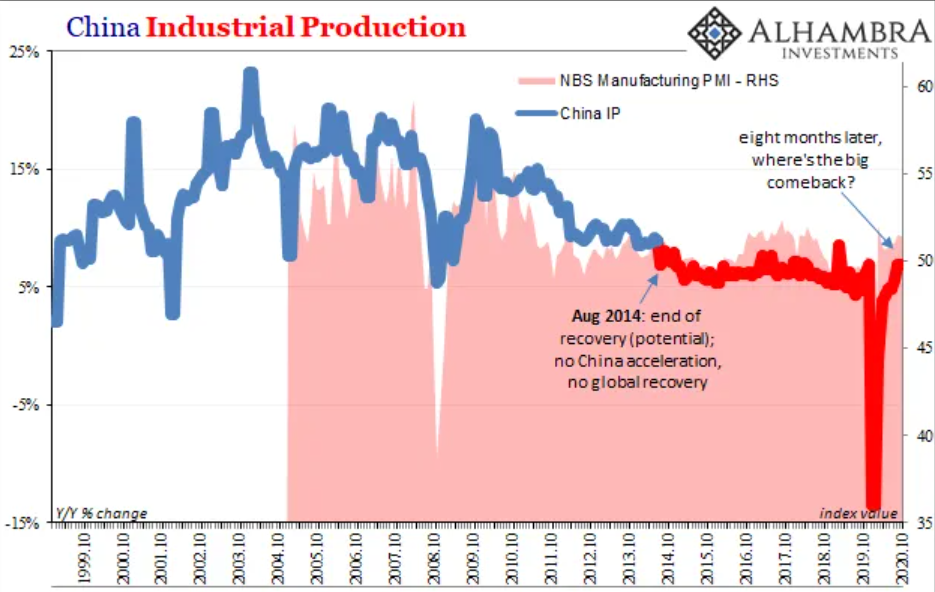 Moving on to the last piece of macro data (but not to be the least), imports and exports, which represent the condition of global trade, suggest what I have been claiming, despite the apparent absolute recovery in China. Unfortunately, the developed realm has yet to follow the Red Dragon. Without a recovery of global trade, you can kiss the reflation story goodbye. The reason for the DM being struggling to get these figures, particularly exports, to pre-covid levels is that their currencies jacked up, in comparison to the EM ones during the March financial meltdown. On account of financial conditions remaining rather tight, although liquidity woes have gradually alleviated, these currencies are still relatively strong. Accordingly, the goods from the EM are cheap(er) to us and our goods are, in turn, (more) expensive to them.
Finally, in terms of market-based inflation expectations, which are more illustrative than any survey and any bank's or government entity's forecast, these indicate a much more terrifying outlook. For all the hype around the ballooning balance sheets of central banks and strategy review announcements, like the recent one made by the Fed, market participants do not even believe the inflation rate, in the US, is going to average 2% in the second half of this decade. Obviously, if you tune in on the financial channels, read their articles or listen to the speeches by central bankers, you are definitely not going to get these insights. In view of the fact these are (financial) market signals, these will set the stage nicely for the final instalment of this series, which is going to be fully dedicated to the financial domain. 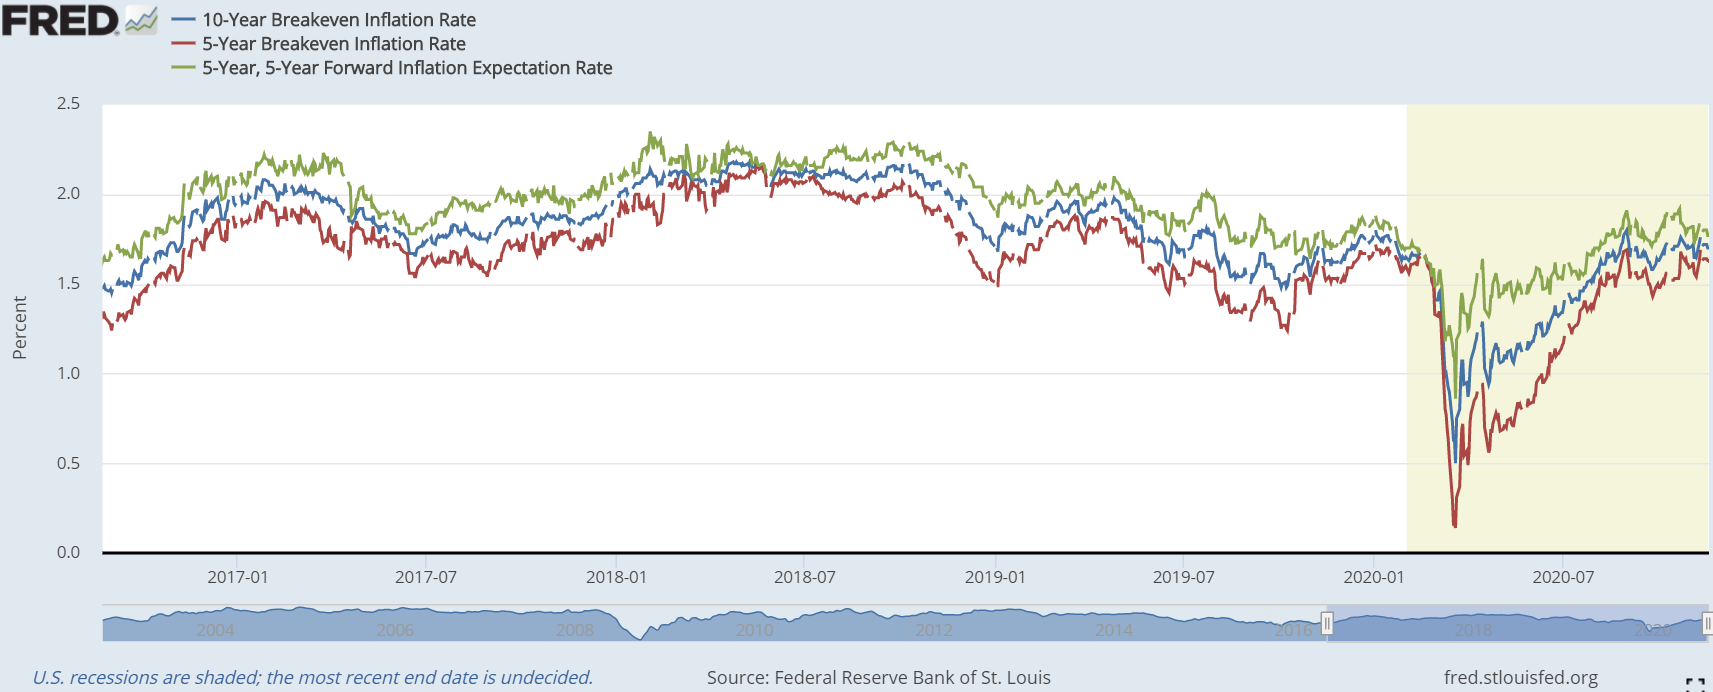 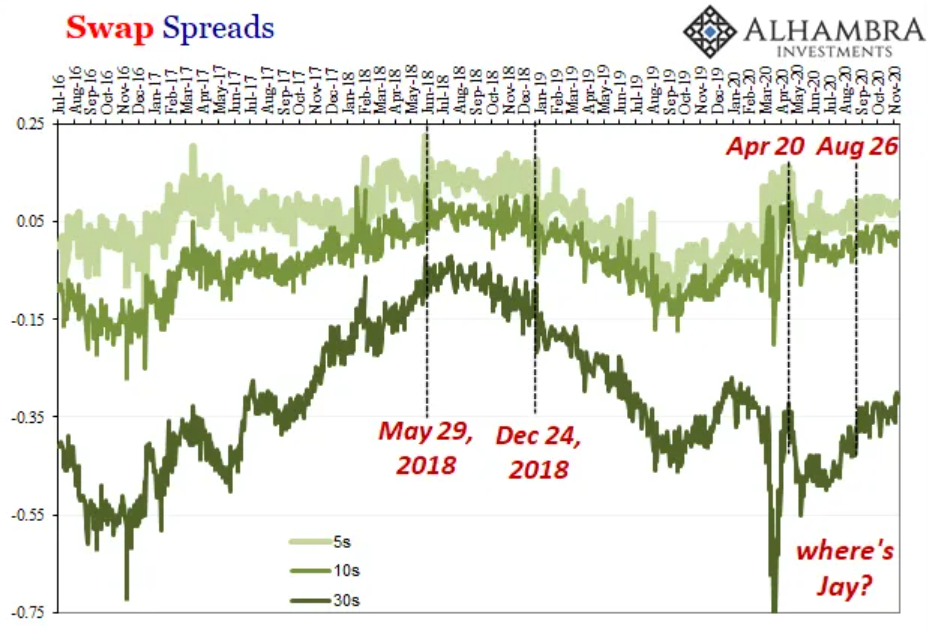 In conclusion, I think I have demonstrated the summer rebound was not sufficiently strong to make up for the lost output during the lockdown-mania. Having lost quite of its momentum around June, the rebound had exhausted almost completely by the time September came.
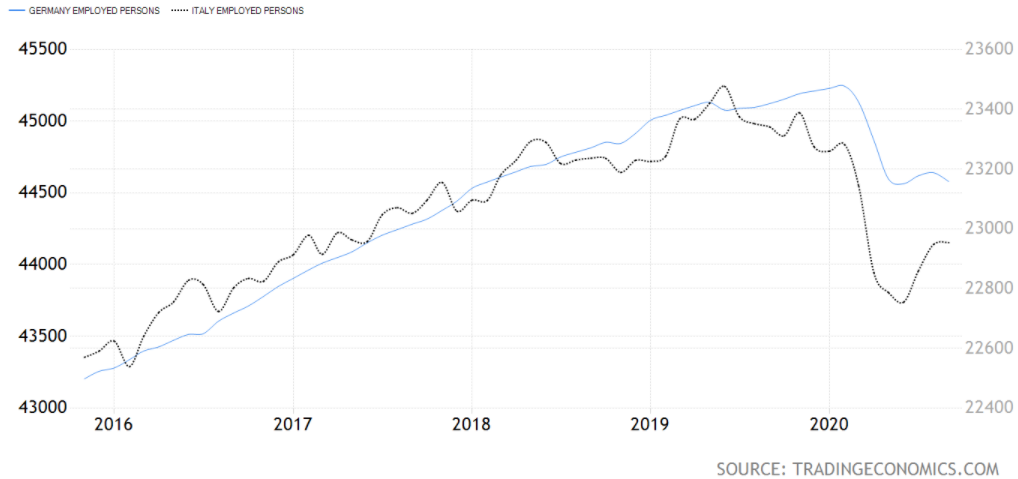
On the next and final chapter of the series, you are going to see that financial markets, from the bond to the stock market and from oil to the dollar, are messaging this exact information. In addition, we are going to figure out how these market participants reacted to the alleged Biden victory - and western civilisation loss - and to the vaccine news. A group of Morgan Stanley strategists unveiled their most recent prospects for the next year, in which they come out very sanguine: "This global recovery is sustainable, synchronous and supported by policy, following much of the ‘normal’ post-recession playbook, (...) Keep the faith, trust the recovery". They have this belief due to more lucid expectations on the coronavirus vaccine, and more certainty on the fiscal and monetary "stimuli" front owing to the ostensible end of the Election Day vagueness - though, it's not over till it's over. Incredibly, Morgan Stanley is not a maverick in the macro analysis domain. In fact, other major banks have expressed the same convictions, such as JP Morgan, Bank of America and Goldman Sachs. In addition, looking at the financial markets and media, a rapid "V-shaped" - or "V-ish", rather - recovery seems to be the common assessment. For instance, according to Jim Paulsen (cited in the last link above), chief investment strategist at Leuthold Group, corporate America’s earnings power may be greatly under-appreciated: "Economic growth has come back a lot faster than people thought and stayed a lot firmer", Paulsen said. "When you take the momentum plus the effect of stimulus plus vaccine discovery, I think growth estimates out there are woefully underestimated for 2021, and that tells me earnings estimates are too". Although the Pfizer and now Moderna vaccine breaktroughs are good news for ending the "casedemic" paranoia, will it also cure the economic malaise? In this three-part series that is the question I am going to answer. To make long story short, the damage is done and we are all going to face its horrible consequences. Hence, this in-depth analysis containing a myriad of economic and financial data is surely going to put this bullish nonsense to rest once and for all (hopefully). To begin with, considering the numbers that have come out since the end of lockdowns and phasing-out of restrictions, on the surface one may feel the economic activity has been resuming at a pace consistent with the "V-shaped" recovery narrative. With that said, on this first instalment, a bunch of data that supports this viewpoint is going to be presented. Nevertheless, do not get your hopes up. 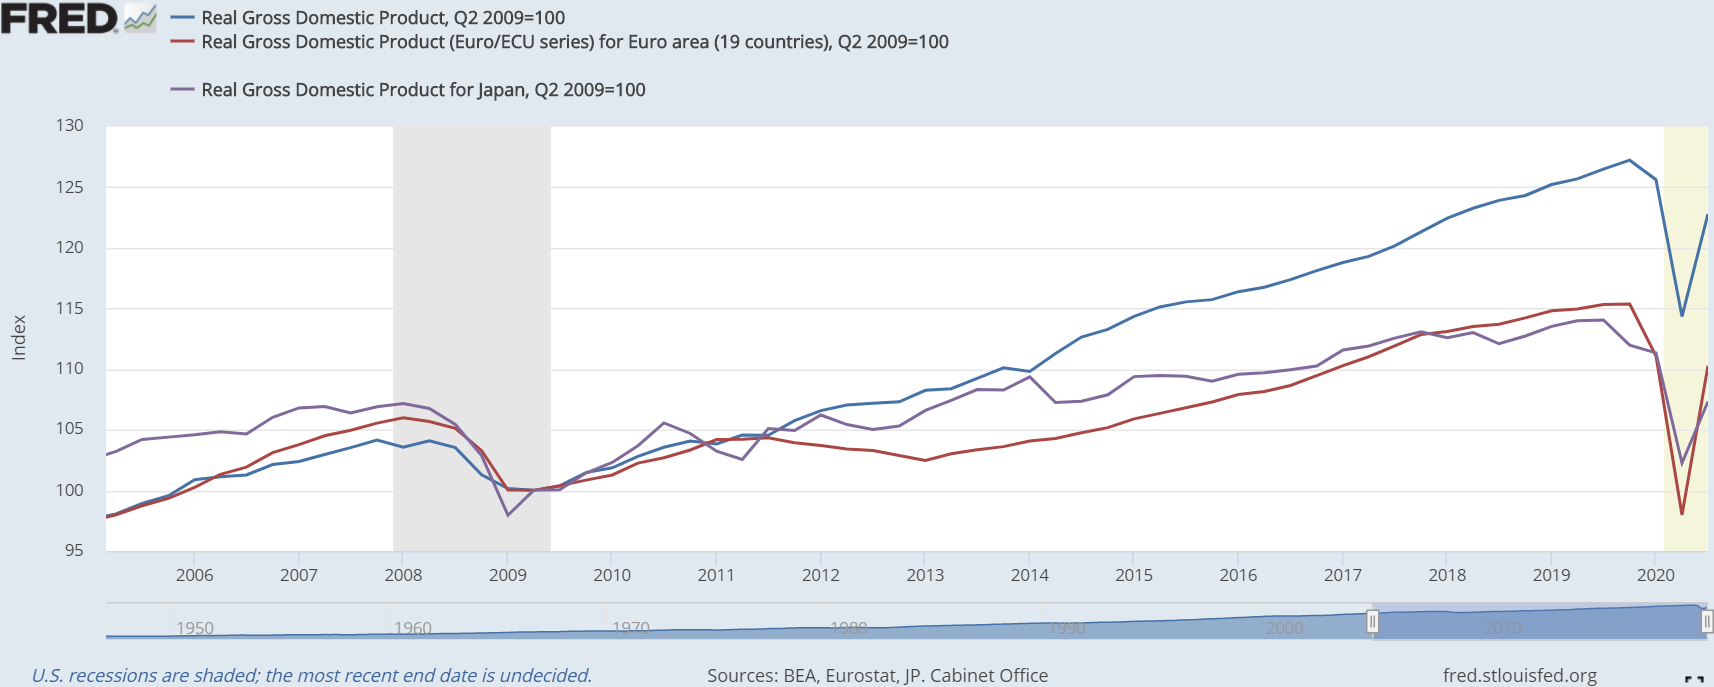 More noteworthily, the GDP growth for the third quarter was the best for most countries in this post-war era. To wit, in the US, the EA and Japan the GDP QoQ rate was 7.4%, 12.6% and 5%, respectively. Surprisingly, these figures caught a lot of people by surprise, not that they were expecting a continuation of the downfall, they just did not believe their belief that such a comeback so quickly was possible. Be that as it may, this single statistic does not tell the whole story. In fact, this spurt is easily explained by the reopening of the economy in the summertime. In spite of resembling a "V", it came up far too short. In order to be a full "V", the right (rising) side has to mirror the left (falling) side. Obviously, the left part is, as of yet, not even half of what it has to be for the "V-shaped" prophecy to be fulfilled. Similarly, employment has soared throughout this period in the small sample of countries that have released the figures of this statistic for the summer months. All the same, one can note a slight deceleration of the job growth, or even, in the case of Germany for example, an inflection to the downside in the more recent months - but I am sure this in no way signals what is right around the corner. 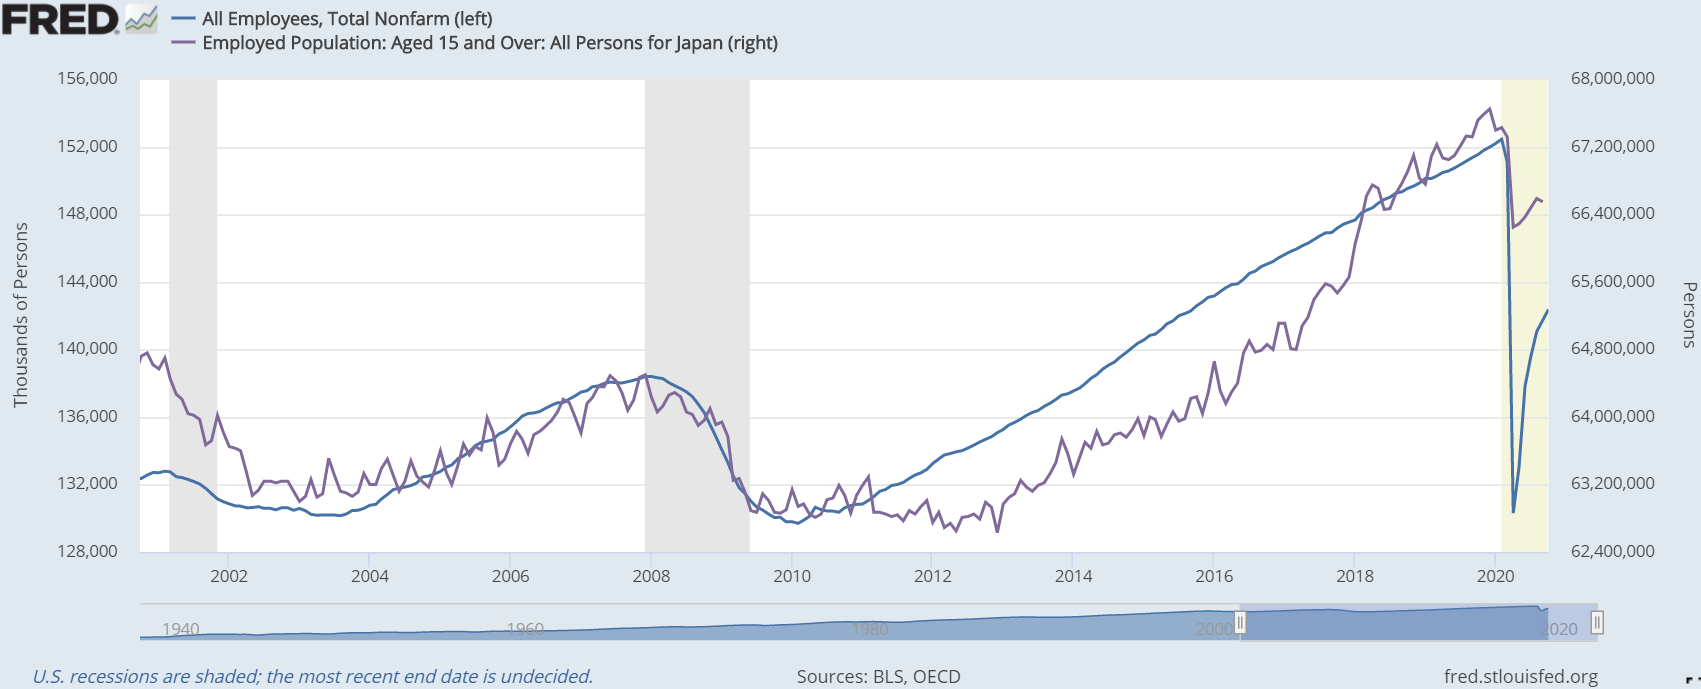
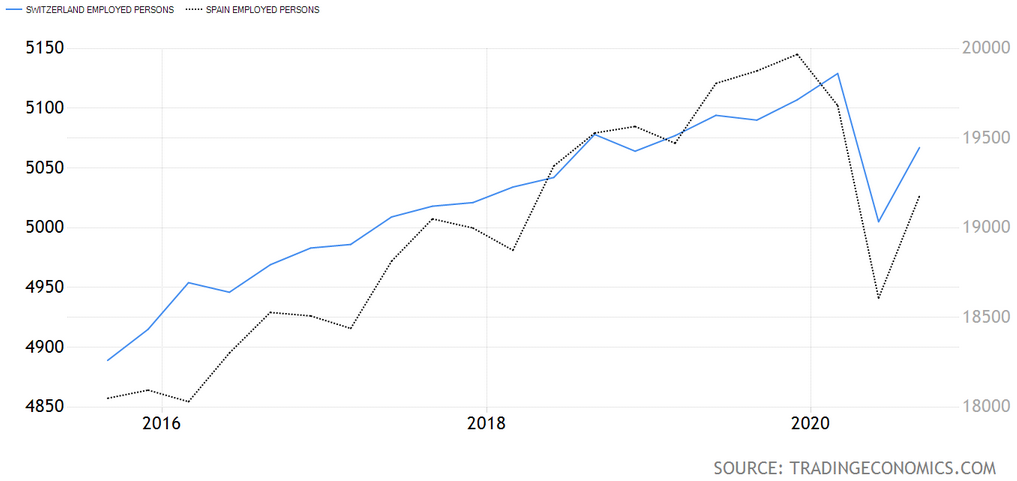
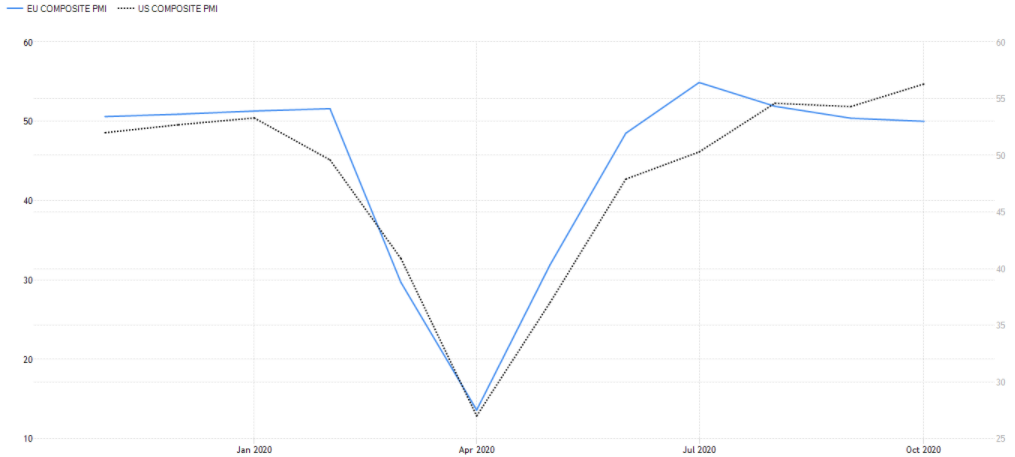
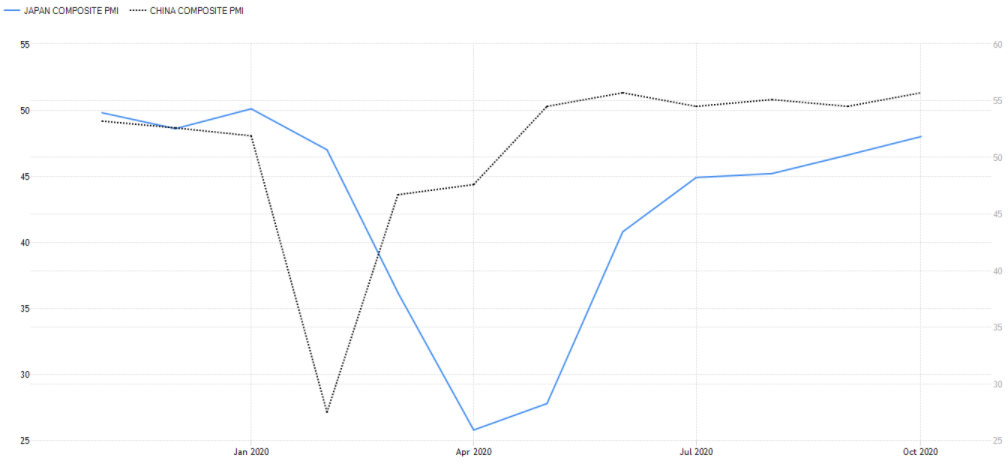
In view of the fact the US has the greatest display of relevant economic data, as well as speed in which they come to public, I am going to focus more on this region than on the others, simply because they have a broader and more detailed information. Thus, to have a better sense of what is happening in the labor market and in personal income, the Land of the free is going to be the sole indicator, acting as a proxy for the state of these parameters worldwide. Therefore, let´s delve in the States job numbers. After the paranoia-driven shutdown of the economy was drawn to a close in late spring, most of those who had been laid off or furloughed began returning to their jobs quickly. However, when we got to June, the reopening momentum started to fade. As you will see, this month comes out in several statistics and markets as a turning point. Moreover, the still huge level of initial jobless claims, when compared to the pre-covid paradigm, indicates that the businesses which maintained their workers, for believing the economic halt would be easily and quickly reversed, are now shedding useless staff members since keeping them would be too costly for the current, and possibly expected near-future, level of demand. 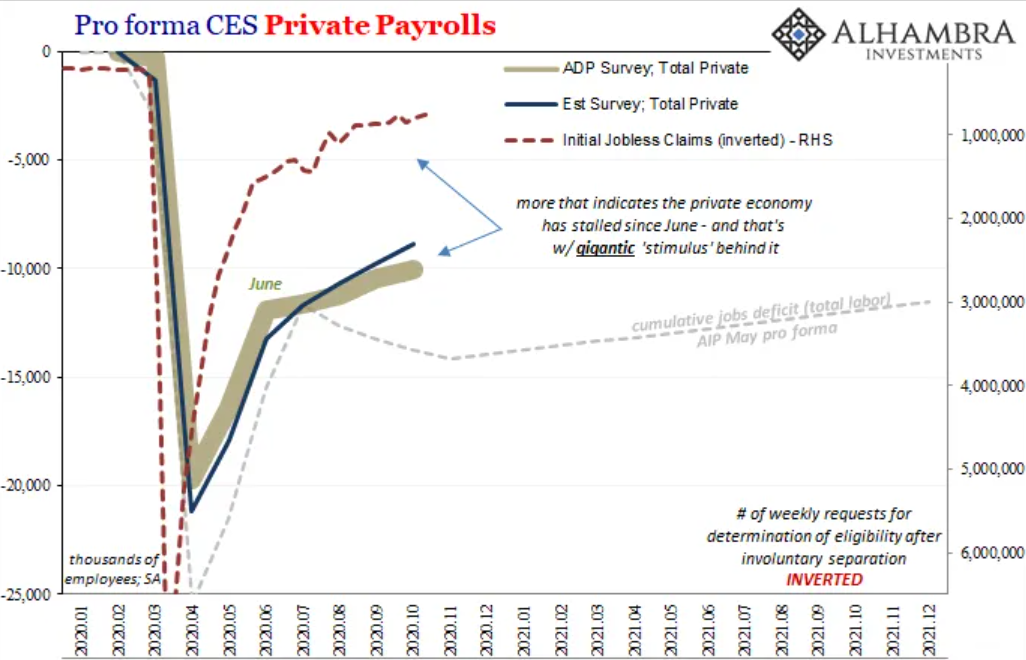 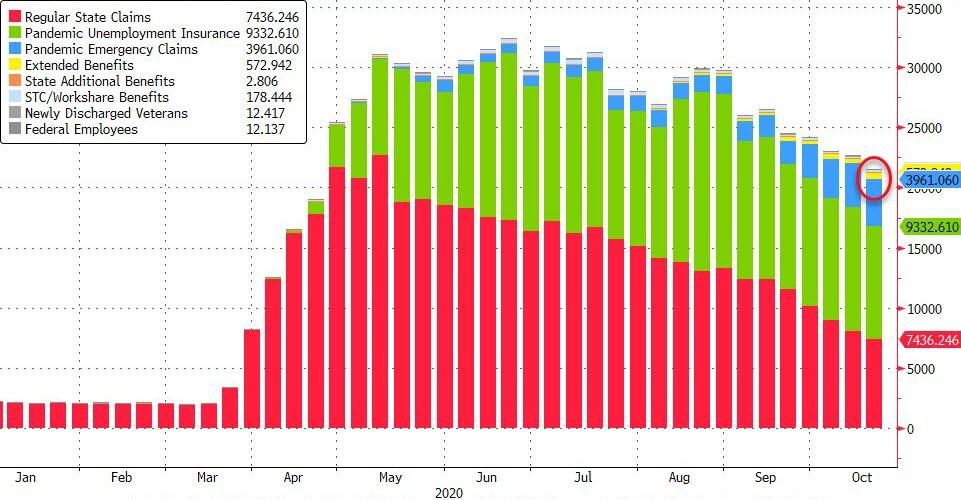 As a matter of fact, the recovery is really taking a much longer time than the "V-shaped" recovery fanatics were antecipating. Just by taking a look above at the evolution of continued jobless (state) claims and the federal unemployment assistance schemes (unit of measure is thousands), there is no doubt the so-called recovery is extremely lethargic - ups! this segment was supposed to be exclusively made of good news; oh well, I tried. Like I stated on the post of November 2, "although state claims are falling rapidly, the extraordinary joblessness benefits brought by the CARES Act are increasing in demand. Therefore, the continued (state) claims are plunging only because the recipients are exhausting their eligibility (each unemployed person has the right to receive unemployment insurance up to 20 weeks). Then, since they still cannot find a job, they move over to the federal level for the unemployment compensation". As a result, the unemployment rate in the US, which skyrocketed in March, has nosedived since. Curiously, other countries, especially in the developed realm, have had a very different experience. In the EA and Japan for instance, have been surging from March onwards relentlessly, though only slightly compared to the upswing in America. This is due to these countries' governments carrying out policies encouraging businesses to furlough instead of laying off employees. Seeing that furloughed workers do not make their way into the unemployment rate, this stat did not escalate during the lockdowns. Notwithstanding, due to suffering the same (or even worse) lack of demand as the US (and government aid has also been waning), companies have been downsizing. 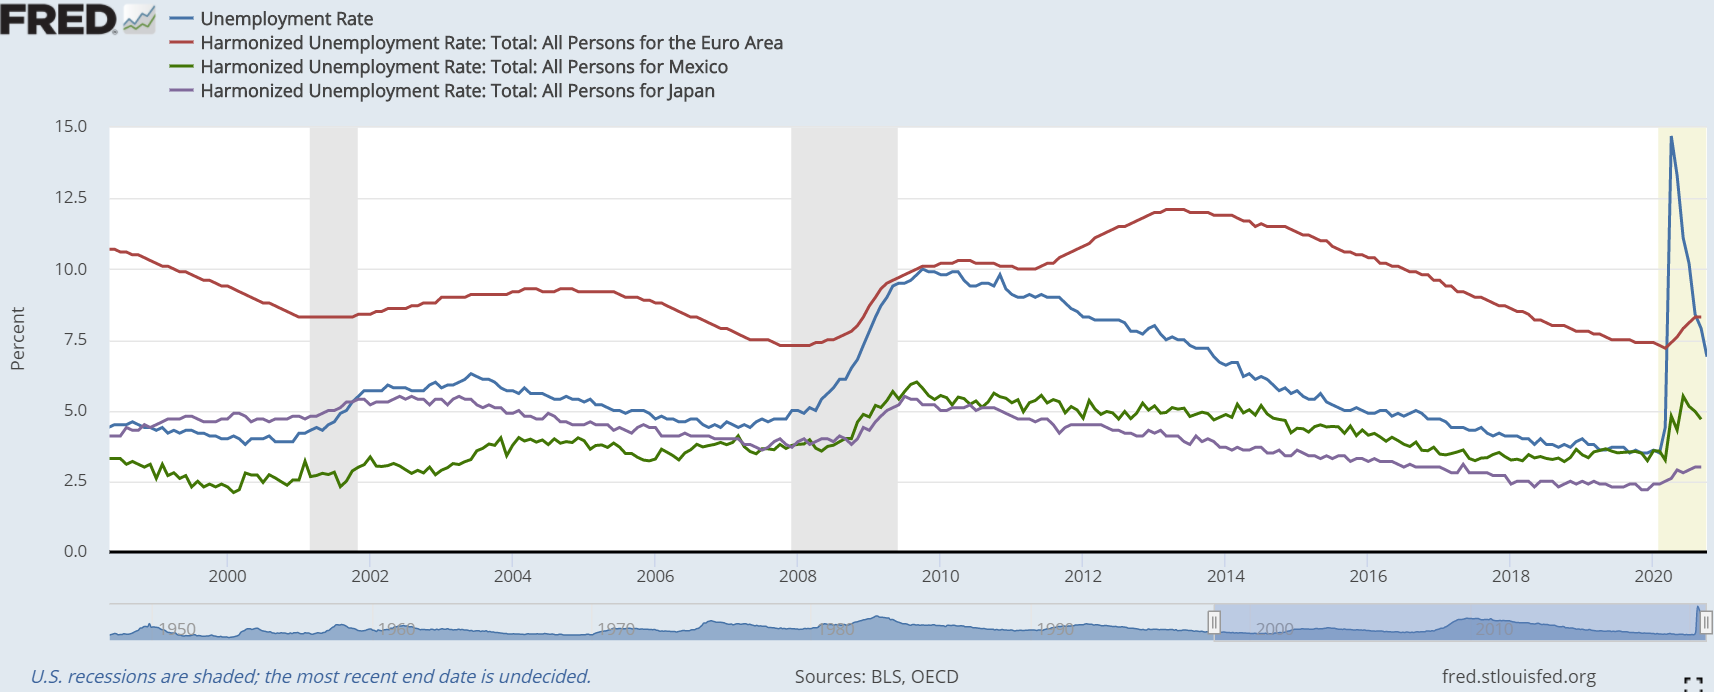 Moving on to the one data point which produced a full "V", retail sales, across the major economies, have reached its pre-covid trend. Mission accomplished! The technocrats were right! Fiscal and monetary stimuli works! Glory, glory, hallelujah! Let's not pull a Biden/DNC and start celebrating just yet, though surely the recovery will go smoothly without any insurmountable hurdle. I mean, everyone in the media says so, therefore it must be true. 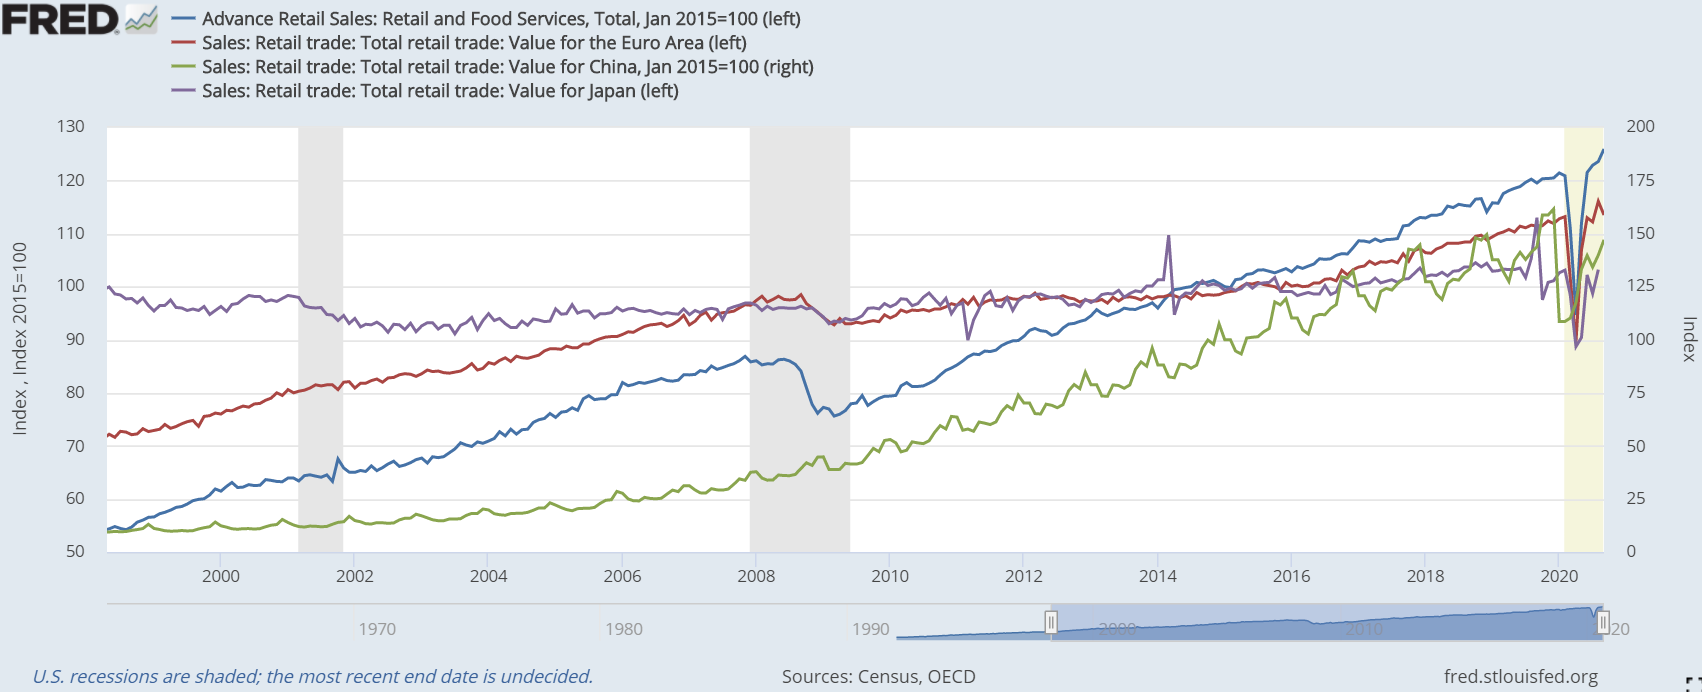 On the flip side, and turning our attention once more to the States, personal income had a full "V" performance as well, although it was an inverted one. As a means of countering the reduced economic activity, policy makers brought about a colossal stimulus and relief package, CARES Act, which put a ton of money in the pockets of the populace (shown previously here). Regardless, personal income without government transfers has had a rather mighty recovery, resulting completely from wage and salary increases. 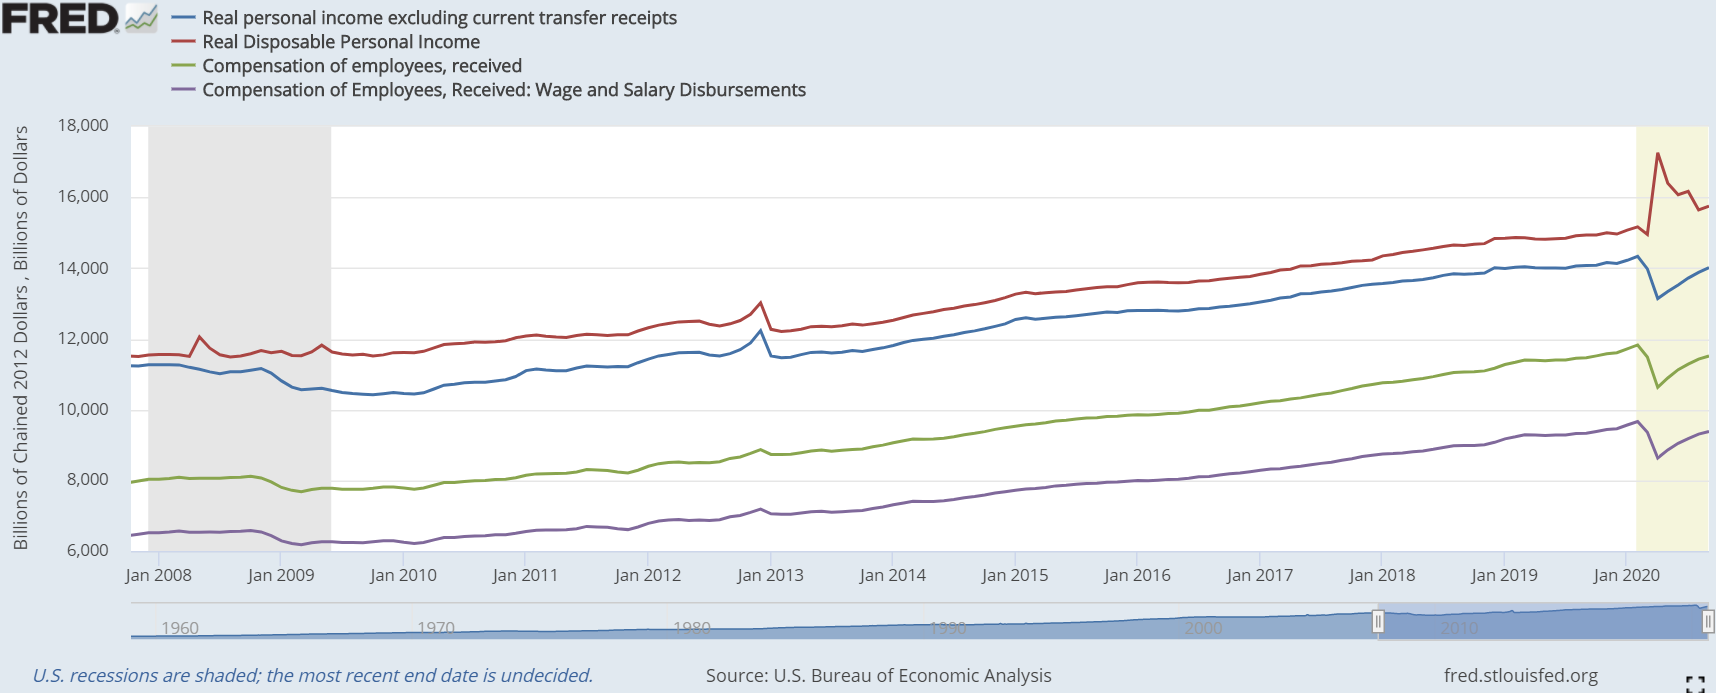 In terms of "soft" data, the prophecy of the desired "V" is apparently in the making. Starting with the PMI's, the index did undoutedly form a "V" whichever region you look. Owing to the PMI's being at pre-hysteria levels or even higher, production must be back at normal, pre-hysteria levels, right? So as to make up for lost time and lockdown-induced slack, these indexes had to be much higher than what they returned since restrictions were lifted. Frighteningly, Japan has to yet yield a positive (over 50) number, meaning that output has been declining since February. Besides, the EA's composite PMI for October was 50, which indicates activity is stalling far too short of a true recovery. Instead of an acceleration in these indexes (numbers much bigger than these ones, at least by 10 points) that would be proof the "V-shaped" recovery was really on track, due to feeble demand,both in developed and emerging markets, the economic comeback is turning sour - damn it! this should have been only about positive news. Interestingly, the right side of the "V" reached its climax in June.
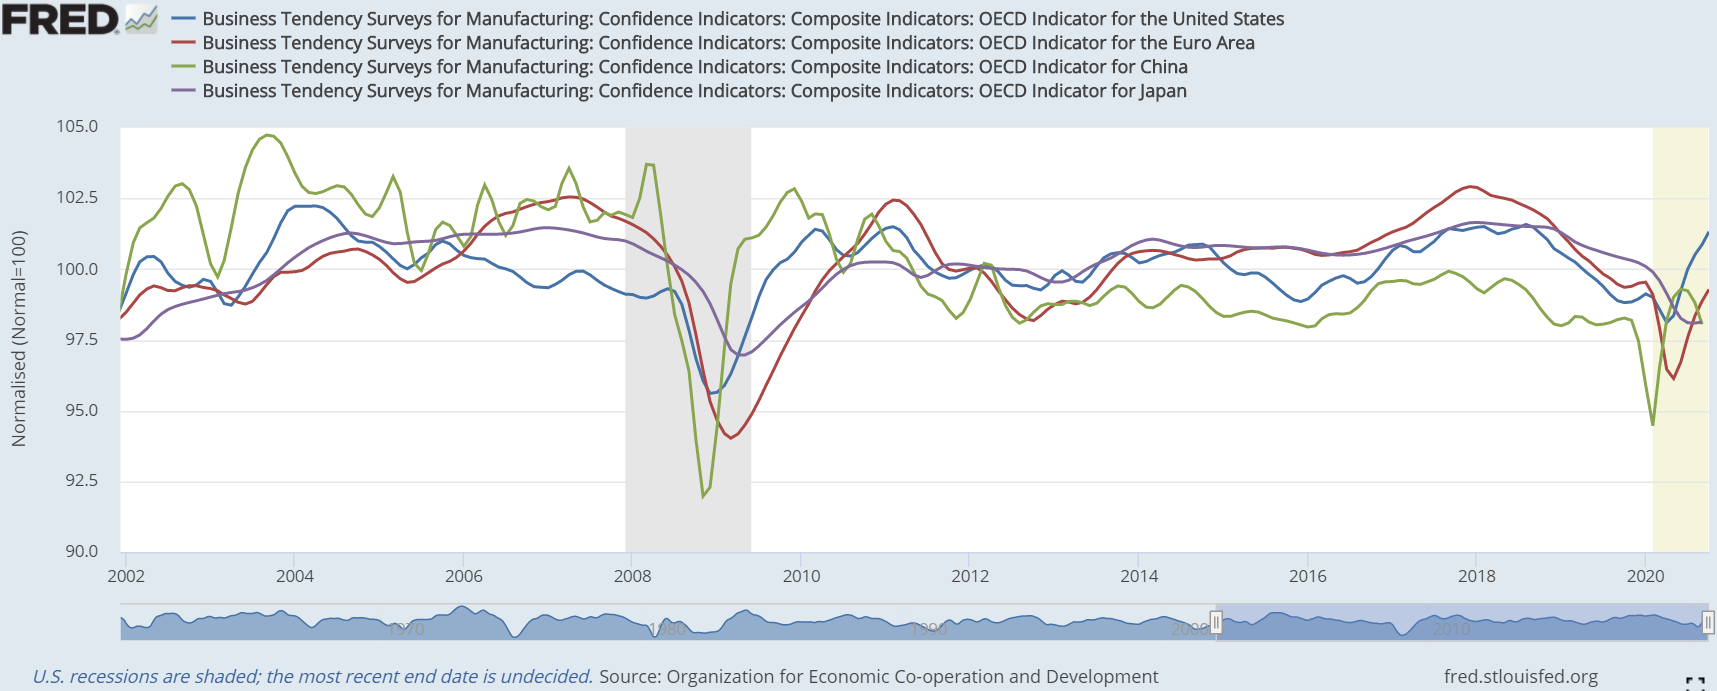
On the bright side, business confidence is on the rise, though only in Europe and America (among the countries depicted below; those indicators are calculated by the OECD using national surveys). Likewise, more so even, consumer confidence has made a nice, quick rebound, bearing in mind there are various reasons to be downbeat. On the one hand, while it seems that japanese businesses, for being swindled by central bankers and fiscal authorities for two decades now, refuse to be fooled again, the niponic consumers are still willing to drink the Kool-Aid. On the other hand, in the Occident, people who pay attention to these matters, particularly in businesses, take the promises made by the technocrats as scripture for some reason. Having failed to meet any of their goals in the last dozen years, it baffles my mind how the majority of the people trust these idiots in power are going to be able to spur the economy into an inflationary boom. Furthermore, while Chinese consumers are still feeling very confident in relation to historical levels, business optimism is waning. Despite appearing odd, this disparate sentiment has an easy explanation. In a nutshell, the Chinese Communist Party, in its most recent 5-year plan, the 14th one, in which they send out small snipetts to the press, has decided to turn its focus to the domestic market. Hence, the Chinese feel appreciated for all this attention, whilst the entrepreneurs in the manufacturing sector, for being export-oriented, are beginning to feel a bit apprehensive. More on this on a future post.
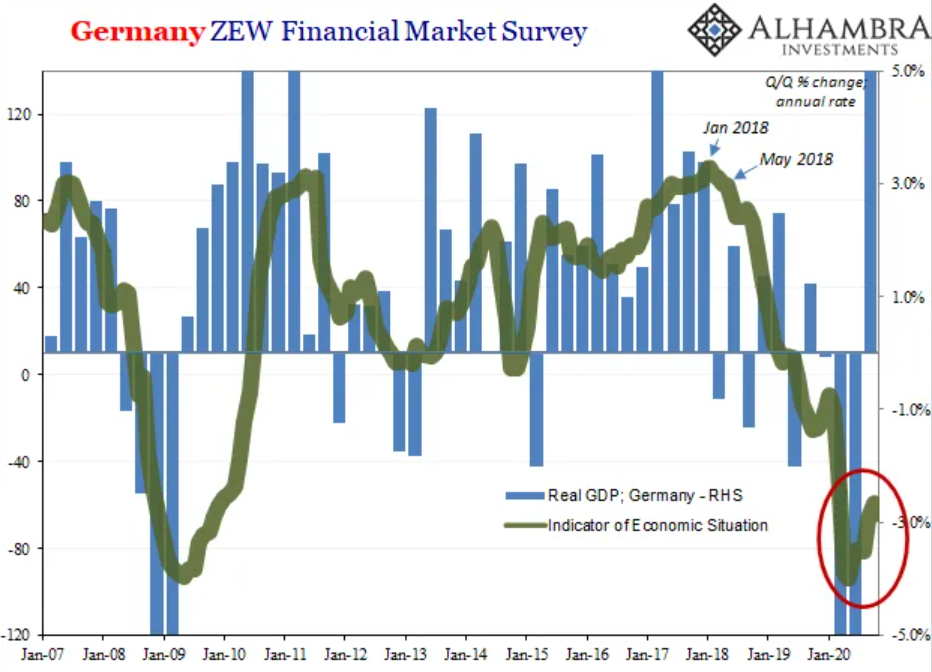
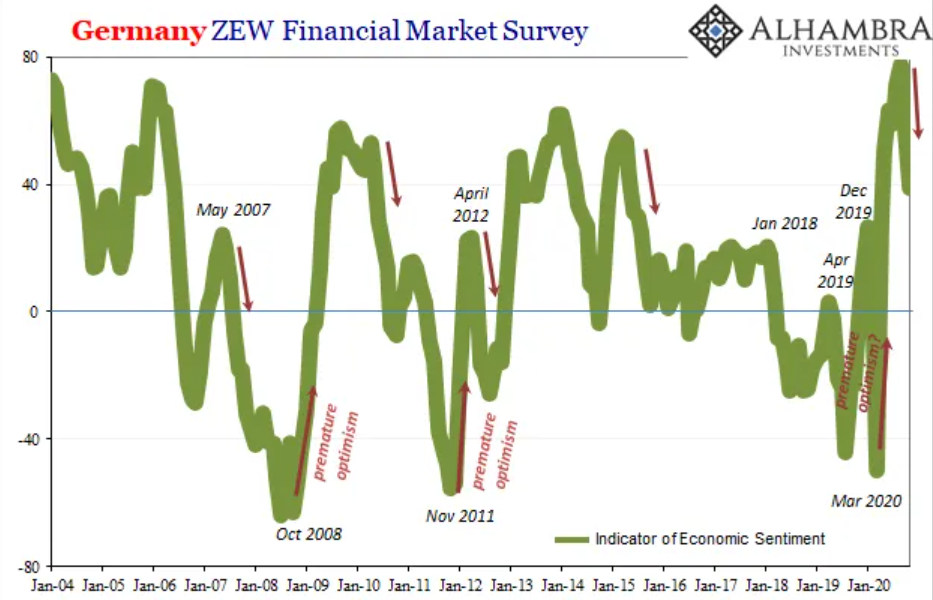
Finally, the ZEW survey for Germany provides an accurate depiction on what is presently occurring and what is already brewing, making it a smooth segway for the next part of this series.
Since employment and output have been improving, despite the increasing sluggishness that I have just shown, it is no wonder the indicator of economic situation (left chart) is jacking up. Au contraire, the indicator of economic sentiment, albeit having surged up to the end of summer, the latest ZEW number for it dropped sharply in November after having done the same already in October. Combined, the index has crashed by 38 points; one of the largest two-month tumbles in the series history (it should be noted that this month’s data was collected before Pfizer’s announcement; it may be that the vaccine news reinvigorates sentimental optimism next month even if the situation doesn’t change – or gets worse again). The last time ZEW sentiment collapsed this quickly, outside of February-March 2020, was in the middle of 2012, when faith in Mario Draghi’s first flood of stimulus (LTRO’s) ran aground of Euro$ #2, pushing Europe even deeper into recession. Ergo, this should sound eerily familiar, which may be what we are seeing in these sentiment estimates. In conclusion, in spite of making an effort to only present the data supporting the bullish "V-shaped" recovery, the truth is that, at this time, the amount of optimistic figures are very scarce and becoming even more so as time goes on. On the second instalment, I am going to present more economic and financial data portraying more clearly how the economy performed since the end of the lockdowns until now. As you will see, the summer rebound came out far too short of expectations, leaving us with a ticking time bomb. Until the results started pouring in on Election Day in 2016, some national polls showed that Hillary Clinton had a double-digit lead over Donald Trump. Owing to being completely wrong, very serious doubts were raised about the validity of the polling industry. Will the national polls that show Joe Biden with a huge lead over Trump in 2020 also turn out to be dead wrong? A few days ago, Biden campaign manager Jen O’Malley Dillon made headlines all over the nation when she told supporters “we are not ahead by double digits” and that they should not believe the “inflated national public polling numbers”. Just like so many others, Jen O’Malley Dillon fully understands that most of the big national polls simply cannot be trusted. They are creating a perception that we are likely to see a landslide victory by Biden today, and the mood in this country is likely to shift dramatically when that perception does not become a reality. Without further ado, here are three reasons the national polls are not reflecting reality. I. Oversampling Time and time again, most of the polling organizations that the mainstream media relies upon insist on oversampling Democrats. This is something that the Trump campaign has complained about repeatedly, and yet it just keeps on happening. During a recent appearance on Fox News, Trump’s senior campaign advisor Steve Cortes used the phrase “massive oversampling” to describe what is happening: Speaking on Fox News’s “Bill Hemmer Reports,” Cortes said, “I think polls matter. We pay some attention to them. It’s very critical to look at the inputs into these polls because the inputs often determine the final output numbers. And many of these polls — I haven’t looked at this one yet specifically, but many of these polls have massive oversampling of Democrats". Likewise, according to Zero Hedge, a (relativily) recent Wall Street Journal/NBC News poll that showed Biden with a huge lead represented an “egregious oversampling of Democrats - with 45% of those asked identifying as either 'Strong Democrat' , 'Not very strong Democrat' , 'Independent/lean Democrat' – vs. the 36% of those asked identifying as the same degrees of Republican. 13% of those asked are 'Strictly Independent'." Furthermore, most surveys that have been done on party affiliation show a very even split, and those numbers have not moved very much at all over the last several years. On that account, by including far more Democrats than Republicans in their surveys, these pollsters are going to come up with skewed results that are unreliable. On a side note, if you are still not convinced, here is the full report of "Polling and Media Recommendations" from "The Atlas Project", confirming this strategy to manufacture double-digit leads to effectively chill the vote of the opposition. II. Shy Trump voters Moving on to the second factor, this may be an even bigger one than oversampling. Unsurprisingly to most, Biden voters are far more eager to talk to pollsters than Trump voters are, making it very difficult to come up with truly accurate numbers. In fact, the head pollster for the Trafalgar Group (which I am going to talk about later on), Robert Cahaly, says that his numbers show that Biden voters are "five times as likely to talk to a pollster” as Trump voters are. Just think about it. If a pollster from CNN or the Washington Post called you, would you be eager to talk to that individual? I sure wouldn’t (were I an American). Thus, many Trump supporters are also hesitant to disclose who they are voting for because they are suspicious there might be repercussions. Every polling organization understands that “shy Trump voters” were a major factor in 2016, and it appears that those voters will once again be a major factor this time around. III. Enthusiasm Gap Finally, the third factor making the national polls misleading is that Trump supporters are far more enthusiastic about their candidate than the Biden supporters. The truth is that the race is much closer than the mainstream media is leading people to believe. In addition, one of the biggest stories will be the fact that so many Biden supporters are voting by mail this year. In fact, one recent survey found that Trump voters are more than twice as likely to vote in person on Election Day as Biden voters are. By the same token, another survey found that 74 percent of those that “strongly disapprove” of President Trump are likely to vote by mail. If these numbers are accurate, then we should expect President Trump to have a strong lead when the first votes are counted tonight, although Joe Biden and his entourage will not concede no matter how large the lead looks, for his campaign will be counting on the mail-in ballots to put him over the top. Unbiased polls give Trump the victory Now that I have demonstrated the polls are immensely inaccurate, let us check out what are the polls who correctly predicted a Trump win in 2016 forecasting for the 2020 election. Currently, the major polls give former Vice President Biden more than a 7-point lead nationally against President Trump – according to RealClearPolitics National Average, which is a slight inflexion from a month ago. 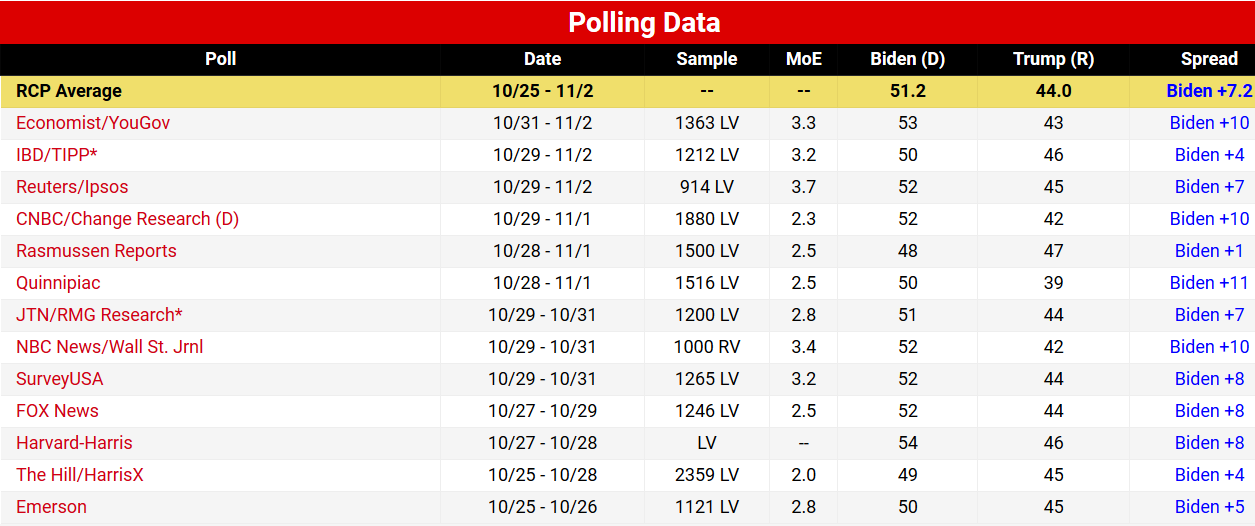 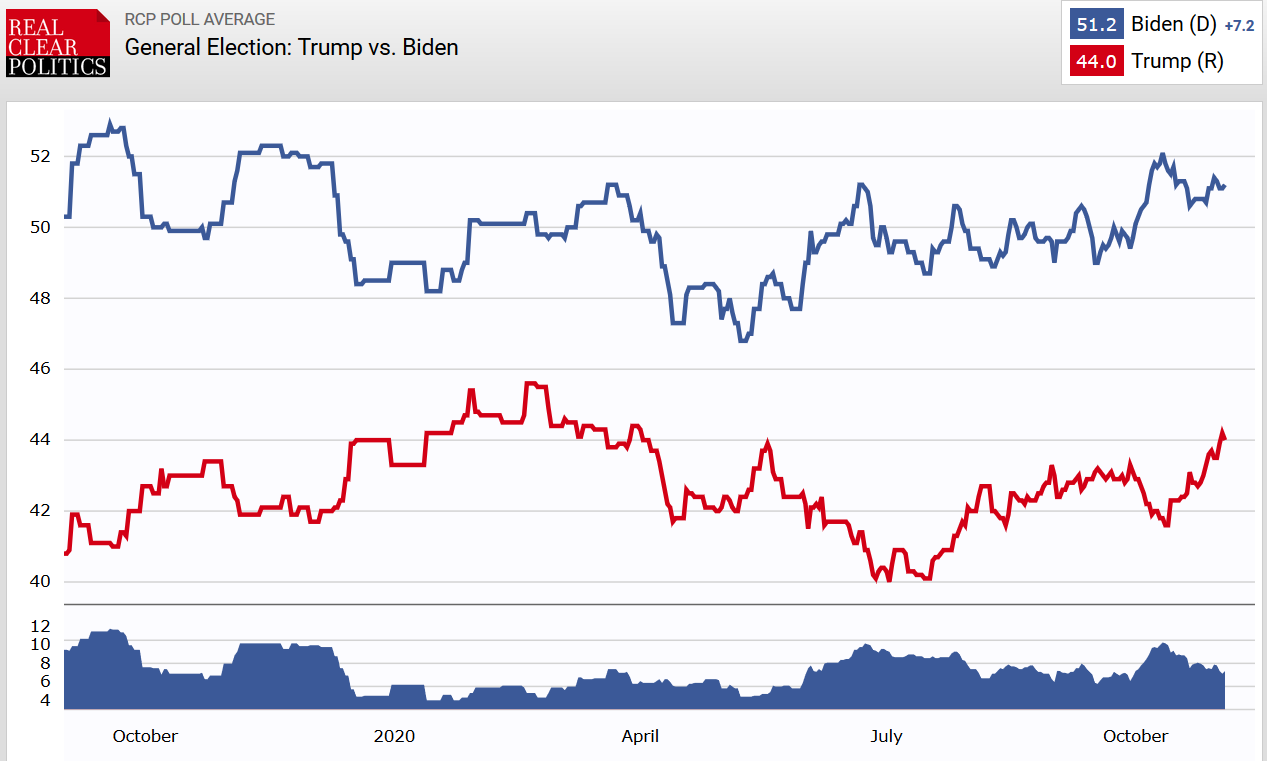 Similarly, the Predictit markets imply a 61% probability of Biden winning today's election. Additionally, those markets suggest that Democrats will win both the Senate and House (58% and 86% probabilities, respectively). Quite simply, it appears that a Blue Wave is fast approaching. Something which the market has not only priced in, but has successfully digested as a favorable narrative for risk assets. In the following Election Review from Camelot Portfolios, we look at what some of the polling firms that called 2016 correctly are seeing today. "Shocking", their polling suggests that President Trump will be re-elected, either narrowly or by a large margin. Therefore, capital allocators today cannot easily assume tonight’s results. Truthfully, it is extremely possible that Trump will win Florida, North Carolina and Arizona. If so, a win in Pennsylvania or Michigan will likely put him over the top in the electoral college. And speaking of "shocking", Camelot notes that as far as the Senate and House are concerned, it also appears that Republicans will keep control of the Senate, especially if Trump has a strong night. On the flip side, the House is highly likely to remain in Democratic control. In 2016, Secretary of State Clinton received 65,853,514 votes, or 48.2% of the popular vote. Donald Trump received 62,984,828 votes, or 46.1%. In terms of the electoral college, however, Trump handily beat Clinton with 306 votes versus 232 for Clinton. So as to be the next Commander-in-chief, Trump won the key swing states in the Rust Belt: PA, OH, MI and WI, as well as the key swing states of FL, NC and AZ. This outcome was not predicted by virtually any pollster in 2016, when most of the major polls were wrong, though not all. 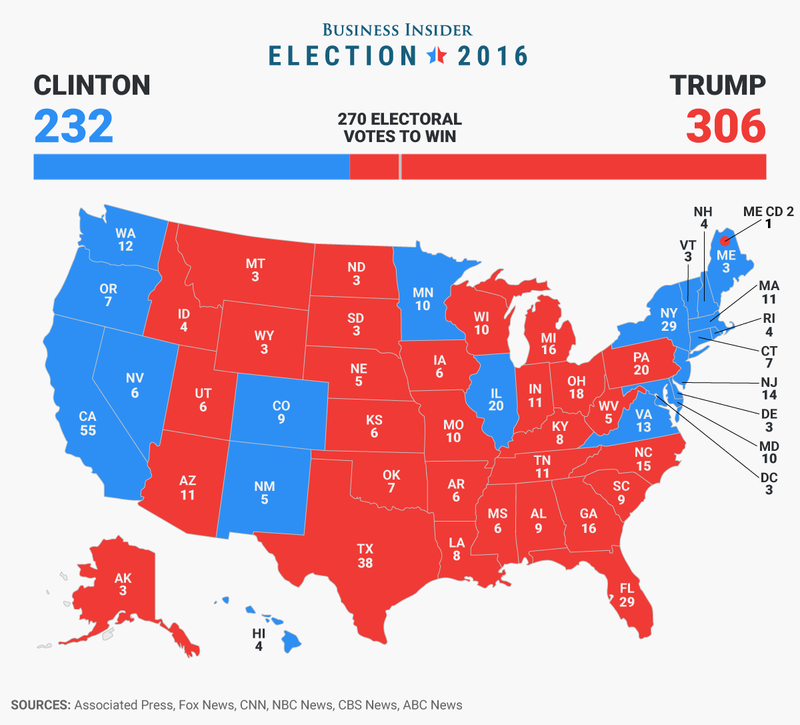 More accurate pollsters incorporated likely voters and attempted to adjust for "shy voters". Among these was Trafalgar Group, which was named best polling firm of 2016 presidential race, for being one of few pollsters to predict a Trump win in Pennsylvania and in Michigan and Trump's victory too. The secret to Trafalgar's success is that it best adjusted its polling to include those "shy Trump voters" and the votes missed in other polls. It begins by presenting the likely firewall states for Trump and Biden. Then, the punchline, what Trafalgar sees as the outcome of tonight's election, based on Trafalgar swing state polls, Trump is going to win with 275 electoral votes. In terms of the Senate race, Trafalgar is foreshadowing another Republican sweep with 52 seats. 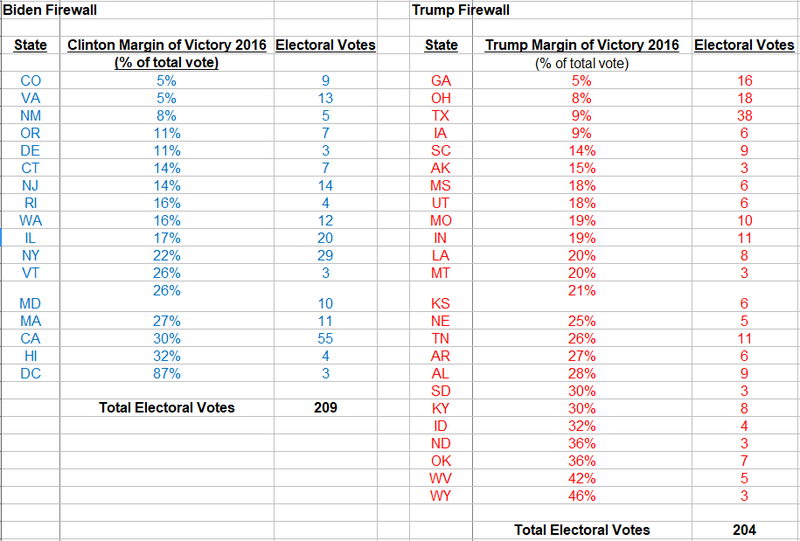 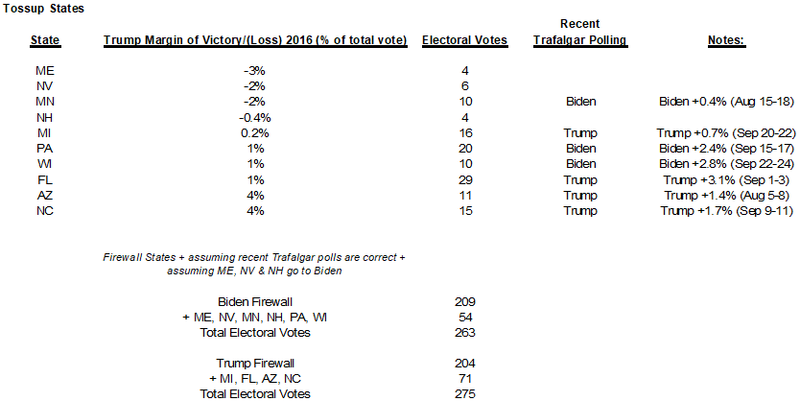 Likewise, Democracy Institute also correctly predicted Trump’s victory in 2016 (besides Brexit). At its latest poll for October, fresh from the presses, Trump leads 48%-47% on the popular national vote, and has a four point lead of 49% to 45% in the key swing states, including Florida, Iowa, Michigan, Minnesota, Pennsylvania and Wisconsin.
Moreover, it only asks likely voters, and asks about so-called "shy votes", which according to this latest poll 79% of Trump supporters would not admit it to friends and family compared to 21% of Biden supporters. The poll digs deeper, enquiring on some hot topics. In a nutshell: i) 57% thought businessman and former Biden associate Tony Bobulinski, who has levelled accusations against the former vice President, was telling the truth about the Biden family allegations; ii) 52% felt that Biden is “a corrupt politician”, with 21% saying they are less likely to vote for him and 75% saying it makes no difference; iii) 54% agreed the allegations made him a national security peril; iv) President’s job approval rating it now at 52% which, according to the Democracy Institute director Patrick Basham, is now at “normal levels” to be reelected; v) almost four in ten black voters approve of his presidency and 21% are prepared to vote for him; vi) Trump’s two strongest issues among voters are still ranked the most important, the economy and law and order, both at 29%; vii) while coronavirus is fourth as the most important issue, pulling 20%; viii) at last, 61% think Trump will be better for the economy, though only 45% approve of his handling of the kung-flu, while 49% disapprove. To sum up, Mr Basham, the director of the Democracy Institute, put it best: "Biden’s comparatively inefficient vote is likely to mirror Hillary Clinton’s from four years ago. Biden will do incredibly well in the heavily populated states of California, Illinois, New Jersey, and New York. In these states, and in others reliably painted a deep Democratic blue, he will rack up enormous margins of victory over Trump, providing him with the potential to score a national popular vote victory, yet probably depriving him of sufficient votes in Iowa, Pennsylvania, Michigan, Ohio, Wisconsin, Arizona, North Carolina, and Florida to turn Trump into a one-term president." In conclusion, in what may be the worst possible news for the markets that are now convinced a Blue Wave is inevitable, a Trump victory along with a Red Sweep in the Senate will surely wreak a lot of havoc in the markets, as well as in the streets of America (powered by Antifa and BLM radicals), creating much more uncertainty about the future. However, after the initial shock, I am sure the markets will eventually accept the results as bullish - bad news are good news after all -, making markets to rally, like it happened four years ago. Surprisingly to some, the third quarter GDP growth was a record-settler, with an annualised rate of 33.1%, in relation to the previous quarter, beating the 32% consensus estimate. So, the V-shaped recovery is in the house! Or is it? Let's dig deeper. Firstly, the US (and global) economy is still climbing out of the huge hole brought about by the hysteria-induced economic shutdown (see chart below). Although the gap from the 2019 Q4 peak is a seemingly minute 3.48%, this means the rift is actually colossal. To get some perspective, the trough of the Great Recession, which arrived at Q2 of 2009, had 3.98% less output than the last quarter of 2007, in real terms. Hence, the current respite of activity is comparable to what was till this year the worst economic contraction of the post-war era, and we are supposed to be happy? As you are going to see, there is no reason to be happy or bullish. 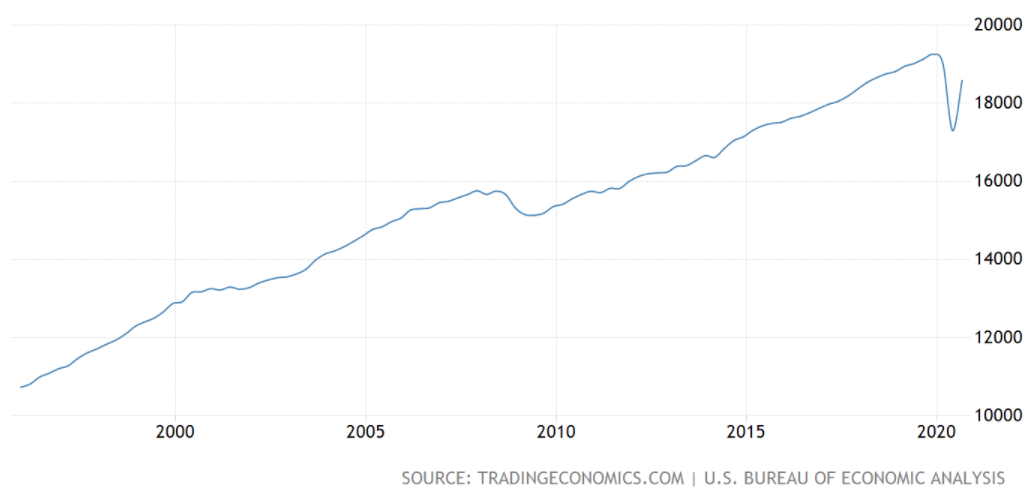 In Europe, the situation is just as delusional as across the pond. The third quarter yielded a record-breaking QoQ rate of 12.7% for the whole Euro Area. Notwithstanding, compared to 2019 Q4, real GDP is trailing 4.29%, as the next graph depicts. Again, to get some perspective, from peak to trough, the output on 2009 Q2 was 5.65% less than the 2008 Q1's level. Thus, no reason to be optimistic too. 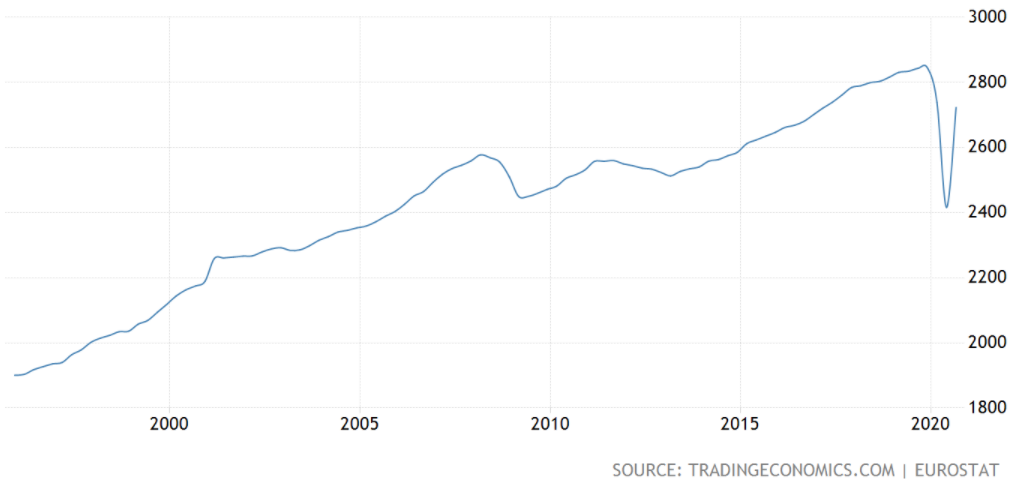 Getting back to the States, what were the factors that led to this outstanding GDP growth? The surge in growth was mostly driven by personal spending, which climbed an annualised 40.7%, also a record, while business investment and housing also posted strong increases. Looking at the data breakdown, the third quarter increase in real GDP reflected increases in consumer spending, inventory investment, exports, business investment, and housing investment that were partially offset by a drop in government spending. Moreover, imports, a subtraction in the calculation of GDP, surged. Interestingly, the uptick in consumer spending reflected increases in services (led by health care) and durable goods (led by motor vehicles and parts). Basically, due to the paranoia spurred by the kung-flu, people who were in need of some kind of healthcare simply postponed their appointments and treatments, either because they were forced to or they pussied out. Regardless of the reason, the hospitals and other medical facilities spent the last trimester cleaning the backlogs that surely appeared insurmountable Similarly, seeing that COVID-19 installed in the collective psyche the moronic fear of human contact and even proximity, it is no wonder nobody wants (even more so now) to commute on public transports, where there is hardly any chance of (anti-)social-distancing. As a result, auto sales had a much needed hike. Obviously, this personal consumption strengthning is to all intents and purposes rather impressive considering the massive contraction that preceded it. However, taking the terrific amplification of the Disposable Personal Income (DPI; second graph below) into consideration, one would think the typical American shopper had become as thrifty as Warren Buffet or Scrooge McDuck. 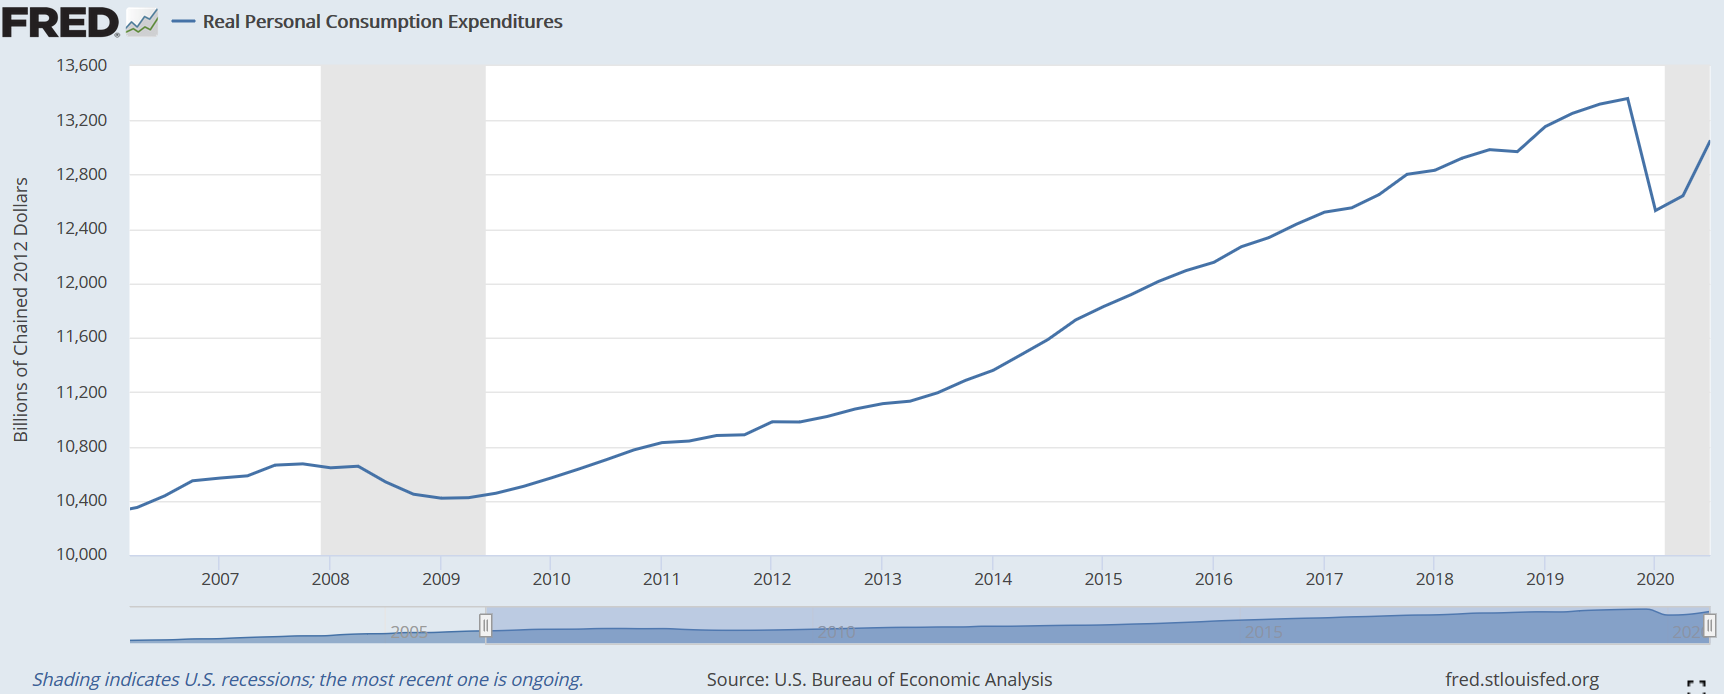 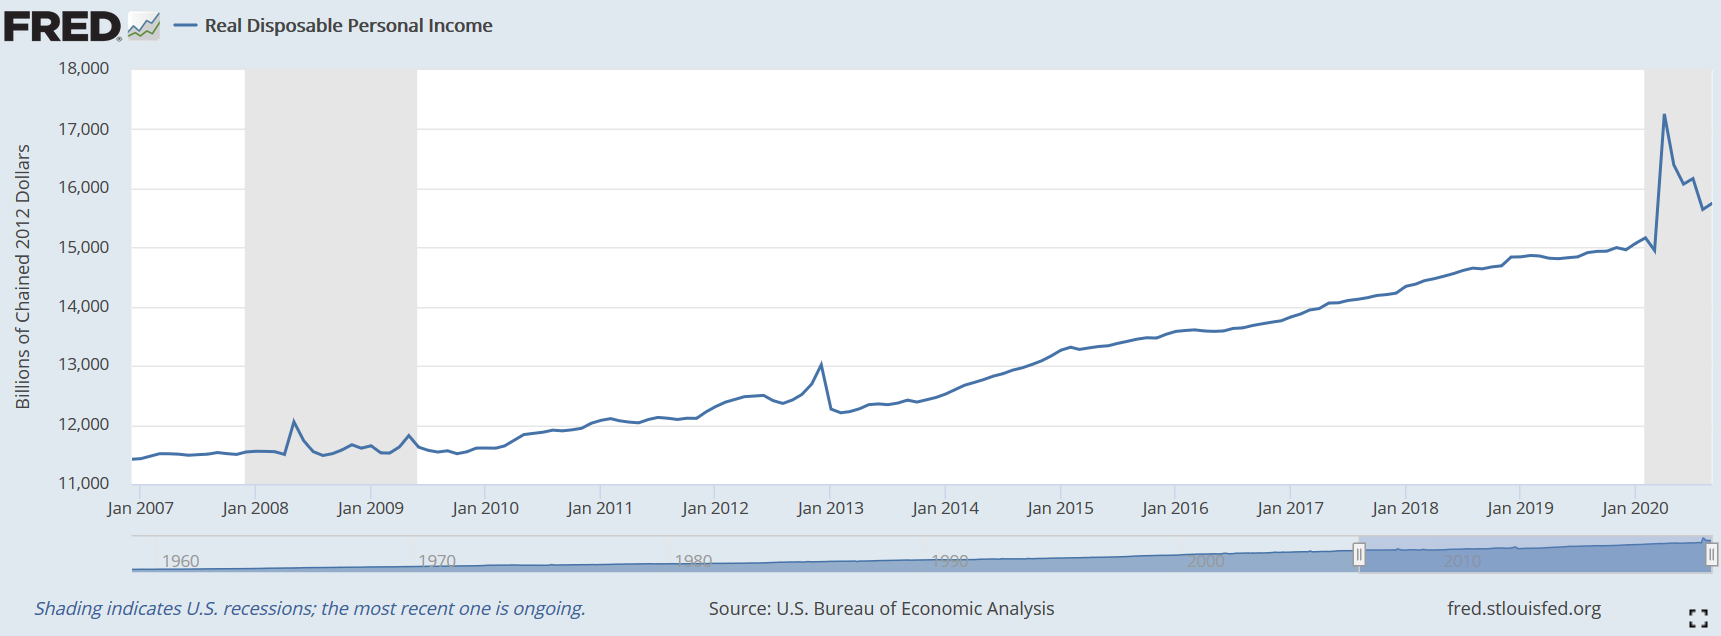 On the one hand, the first of the next couple of graphs shows that the DPI increment did not come from productive sources. Despite rebounding stupendously from the Spring lows, wages and salaries have been losing momentum. This is not good sign for the V-shaped recovery narrative. In fact, it foreshadows a prolonged recovery or even a "double-dip". On the other hand, one can clearly see that the DPI surge on Q2 and Q3 resulted from government transfers, in exclusive and in most terms, respectively. Specifically, the component "Other", in purple, is the main factor for that increase in income. The Coronavirus Aid, Relief, and Economic Security (CARES) Act signed into bill on March 27, created a bunch of programmes, totalling $2.3 trillion, to stimulate the economy and alleviate some financial woes that families and businesses were beginning to experience. Among these, there were: direct payments to families of $1,200 per adult and $500 per child for households making up to $75,000, on a yearly basis; the Federal Pandemic Unemployment Compensation (FPUC), which provided a federal benefit of $600 a week through July 31, 2020; the Pandemic Unemployment Assistance (PUA) that extends benefits to the self-employed, freelancers, and independent contractors; and the Pandemic Emergency Unemployment Compensation (PEUC), which extends benefits for an extra 13 weeks after regular unemployment compensation benefits are exhausted. In aggregate, these extra joblessness compensations add up to roughly $253 billion, while the direct payments totalled almost $300 billion. In addition, the law appropriates $349 billion, on the Paycheck Protection Programme, to be used to support small businesses to maintain their payroll and some overhead expenses through the period of emergency, with the goal of keeping workers paid and employed during the period of the emergency. Likewise, the cash grants of $25 billion for airlines (in addition to loans), $4 billion for air cargo carriers, $3 billion for airline contractors (caterers, etc.) aimed for payroll support. Finally, one can make the case that the $500 bn in loans for corporations, the $150 bn to state and local governments, plus the over $130 billion to hospitals, health care systems, and providers, had the objective of thwarting the monumental lay-offs and furloughs that were occurring - it turns out it failed to follow-through. 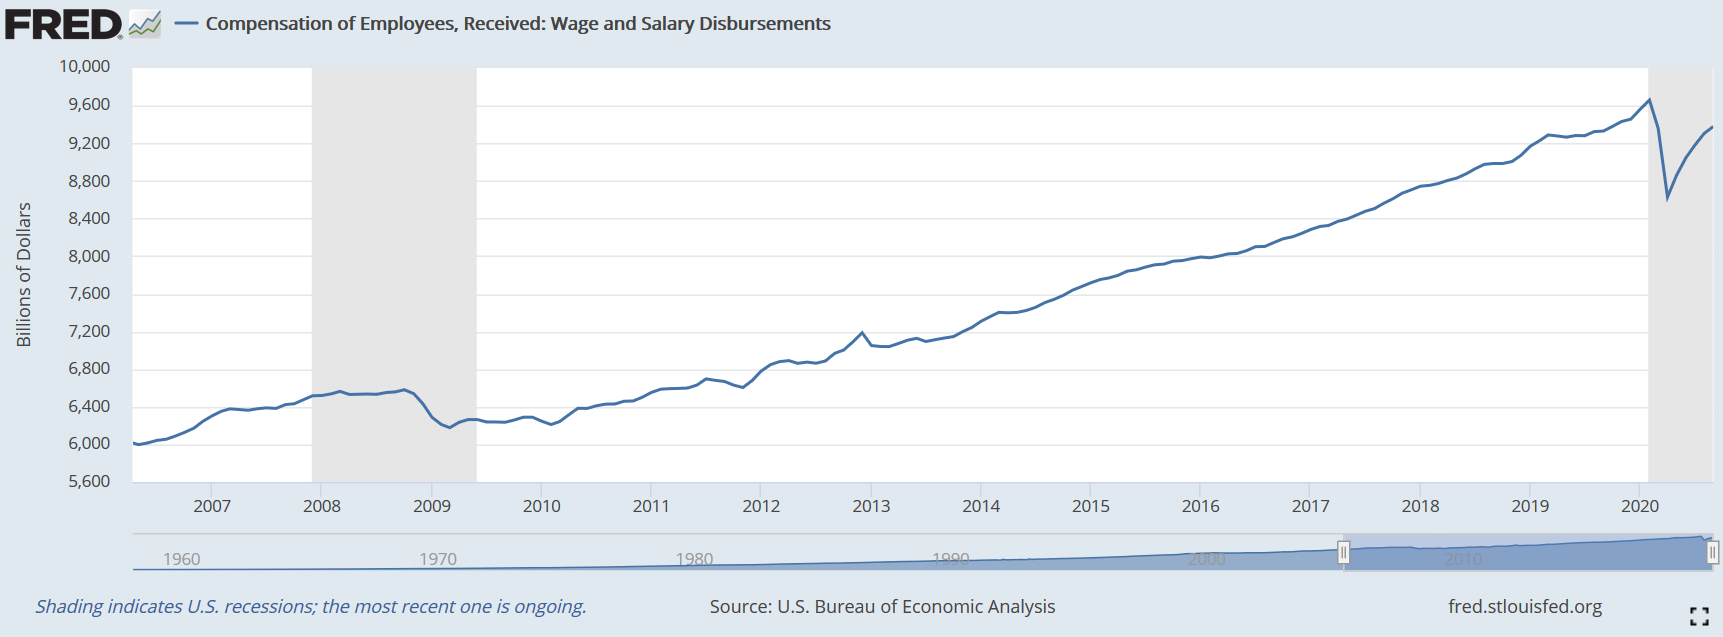 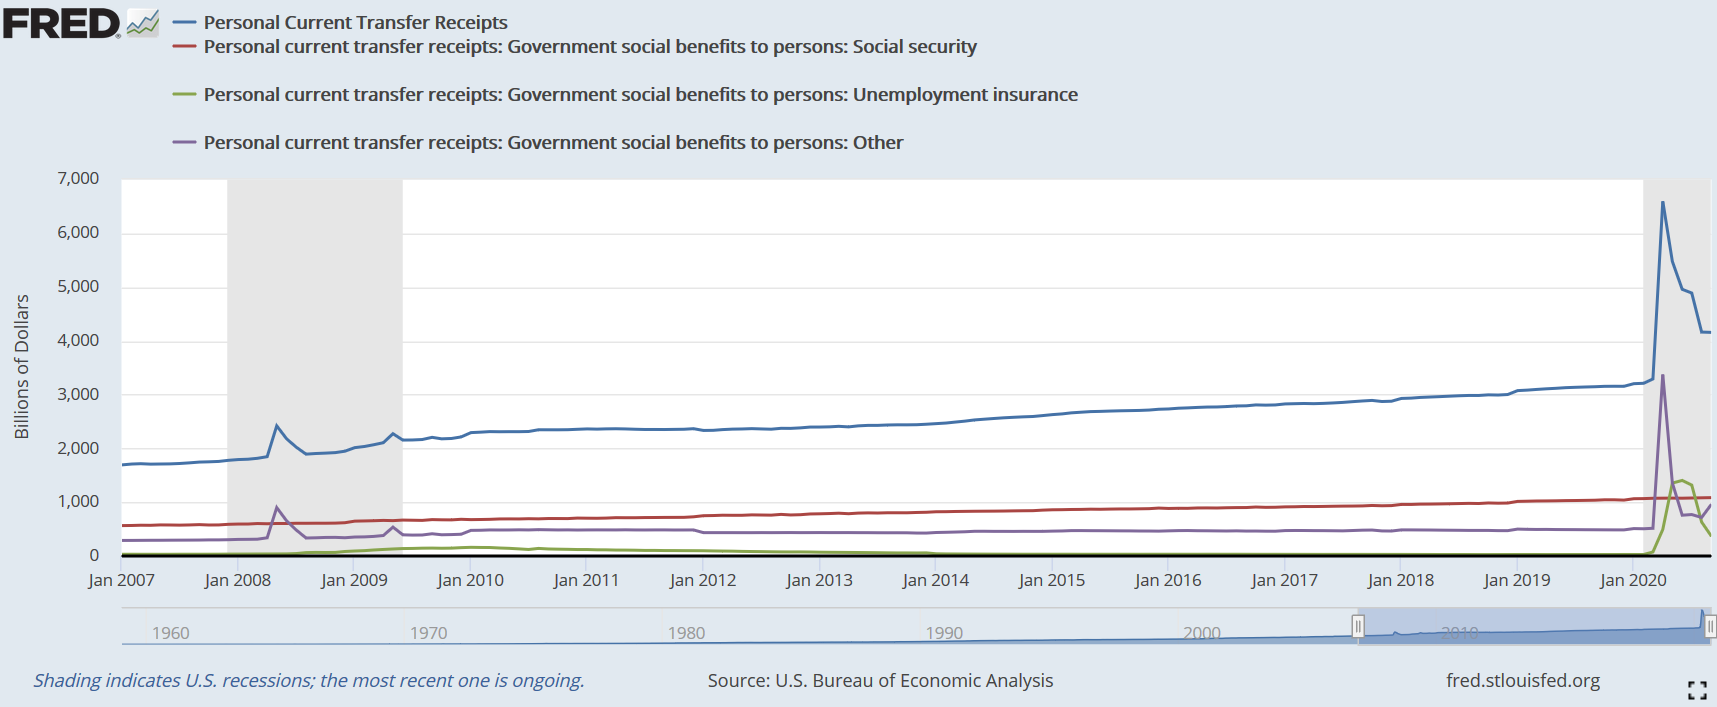 As a possible harbinger of what is to come - or is already coming - the "Other" component above is rising, even though most of the CARES Act programmes have been fully exhausted. The chart below, depicting the evolution of the different claims at state and federal level, indicates that although state claims are falling rapidly, the extraordinary joblessness benefits brought by the CARES Act are increasing in demand. Therefore, the continued (state) claims are plunging only because the recipients are exhausting their eligibility (each unemployed person has the right to receive unemployment insurance up to 20 weeks). Then, since they still cannot find a job, they move over to the federal level for the unemployment compensation. As a reminder, the PUA and the PEUC are going extint by the end of the year. These people ought to pray for the economy to get back to pre-pandemic levels as soon as possible so as not to fall further behind and get under even more financial trouble. Alternatively, - as we shall see after next Tuesday - the 2021 Republican-controlled Congress and federal government could easily pass a CARES Act 2.o to keep the debt indulgence on forever and ever... until it finally breaks. 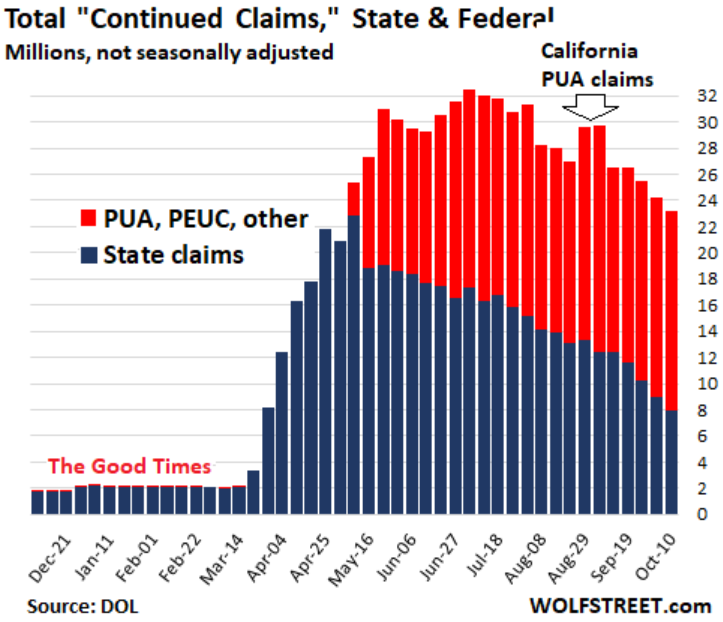 Finally, one can claim with profound confidence the prospects for the quick V-shaped recovery are definitely naught. Like I showed on the last post, both banks and more importantly the UST market are signaling the rebound that just took place during the Summer is rolling over. Even before the resurgence of the kung-flu in the Northern hemisphere, which started as Autumn was as well, the economy was turning sour once more from late August or early September, as the bond and stock markets, as well as the dollar, portray. Besides, the oil market, which is a pretty good indicator of economic activity, is flashing ominous warning signs of reduced economic activity. Since late August, the price of the benchmark WTI crude oil has plummeted, returning to early June levels, when the lockdowns and other restrictions were being lifted. The price drop becomes even more impressive once you factor in the 24% production tumble of US oil. 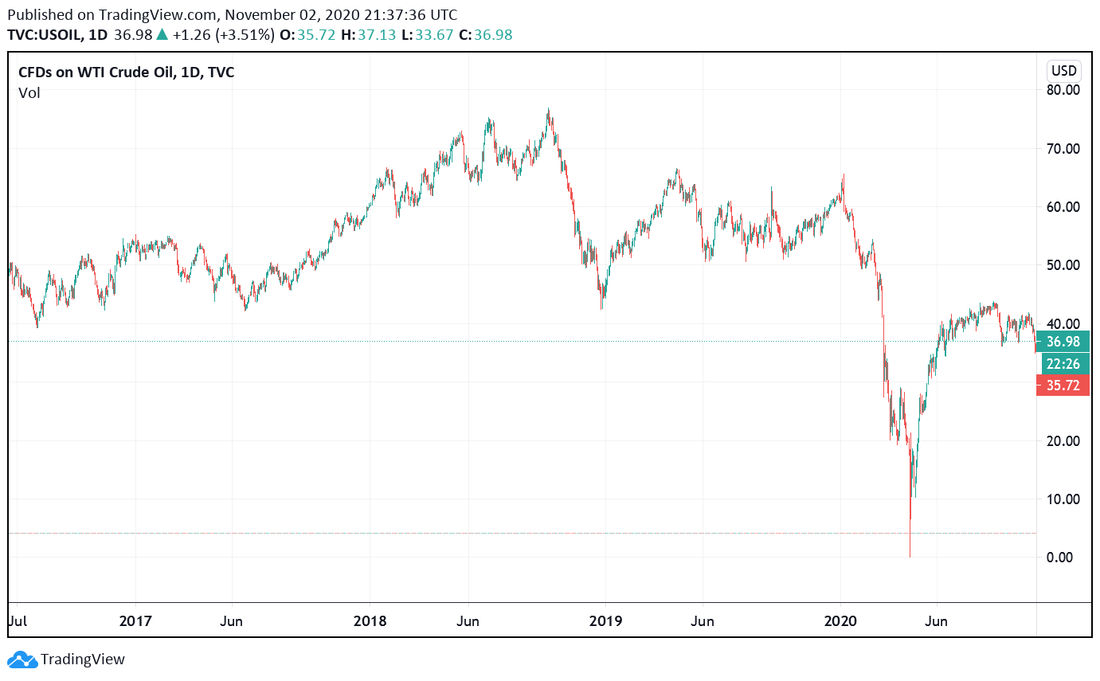 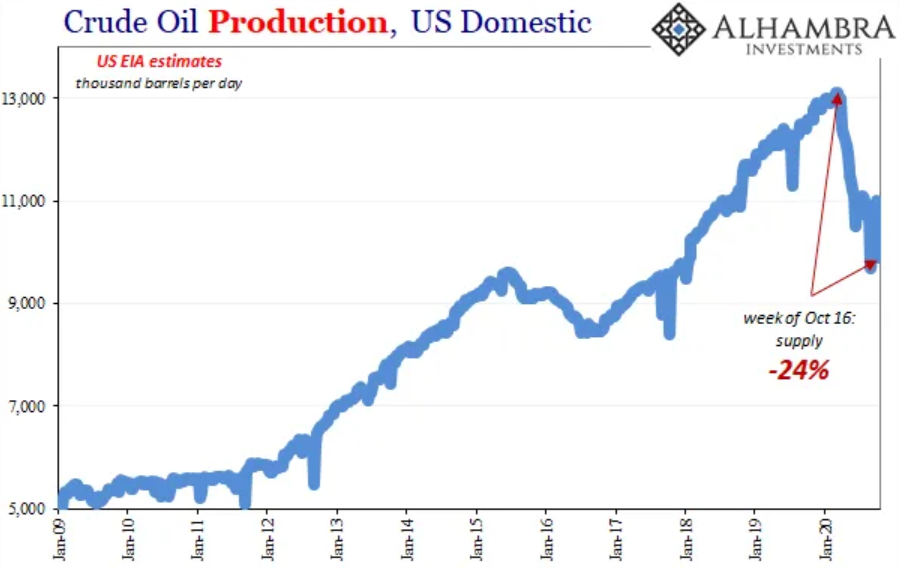 Owing to the madness of our rulers, for insisting on fearmongering and utterly useless movement restrictions and lockdowns, they are turning this already horrendous economic debacle into an epic catastrophe that will result in millions of casualties worldwide, which effects will be felt for many years.
In other words, one of the biggest crimes against humanity is happening right now. Thus, we have to throw a monkey wrench to the global tyranny machinations and make the narcissistic sociopaths in the seats of power sit, instead, in a Nuremberg-style trials. Honestly, those who remain silent and obey these despots should consider themselves lucky as to only getting a slap on the wrist. What picture do all these factors paint? An extremely bleak and disturbing one. In spite of these impressive figures, the day of reckoning is undoubtfully coming. Everybody has just been delaying the inevitable. In addition to all the benefits and compensations, loans and grants mentioned above, moratoriums, frozen evictions and the belief this setback is an ephemeral nuisance easily curbed by fiscal and monetary stimuli were the reasons that made the economy rebound and postpone its inescapable collapse. In order to continue turning a blind eye to the laws of economics, the governments and central banks will throw everything they got out of pure desperation, though it will either ultimately not be enough, too much or completely irrelevant (the latter in the case of monetary policy). |
AuthorDaniel Gomes Luís Archives
March 2024
Categories |
 RSS Feed
