|
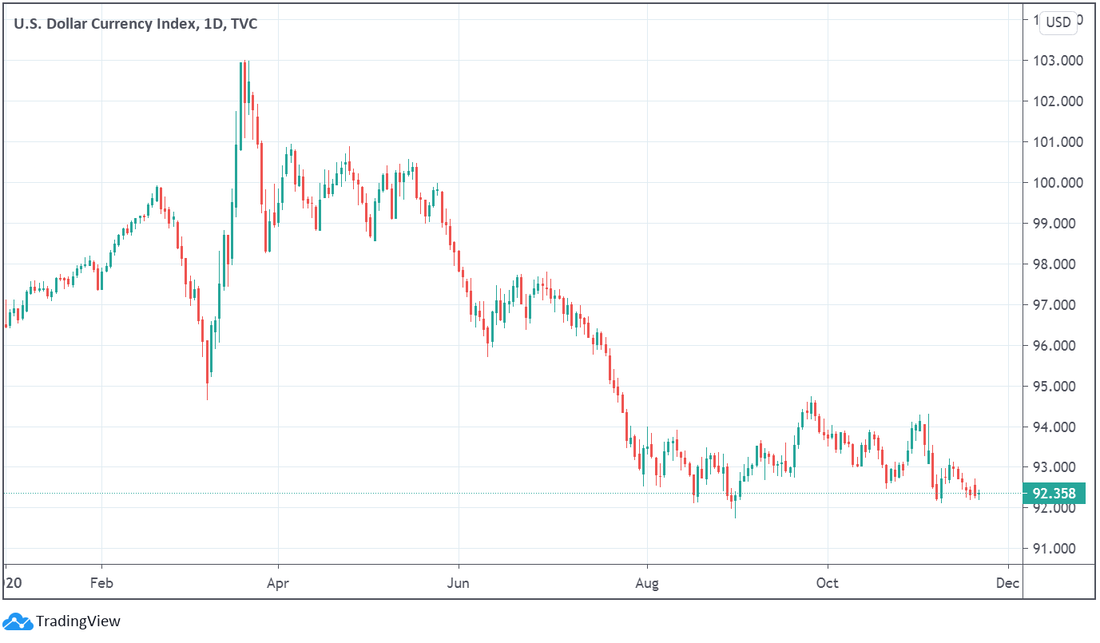
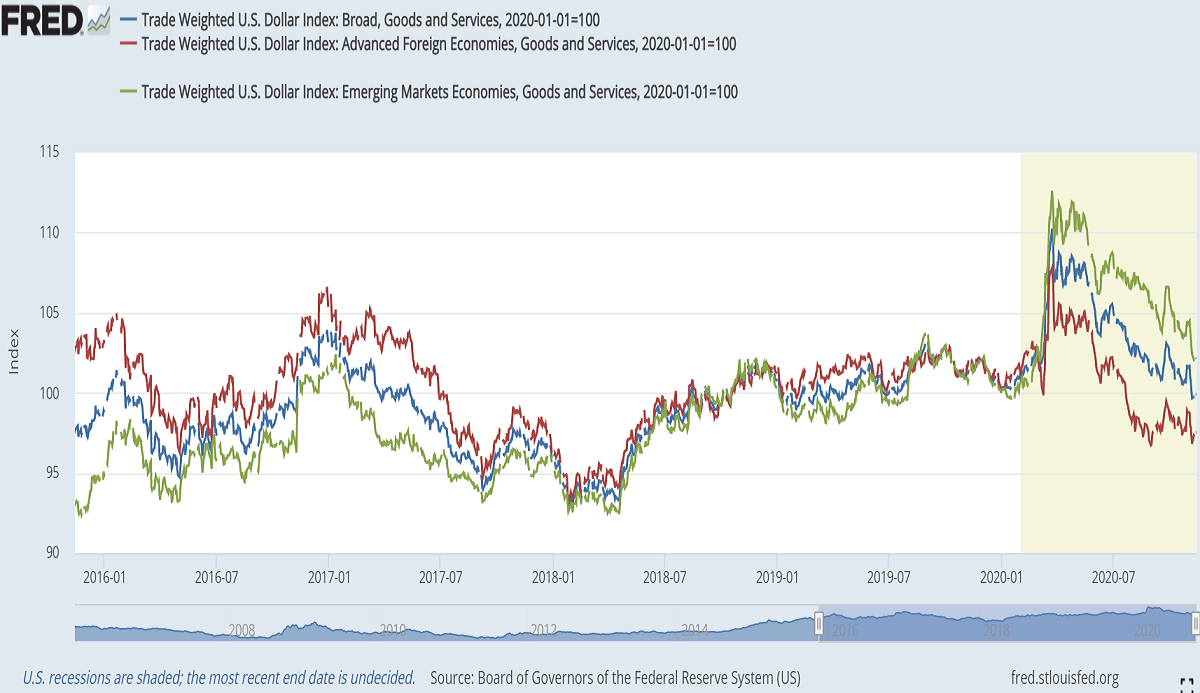
On Thursday, November 19, the markets were hit, after markets' close, by the announcement made by the Secretary of the Treasury, Steve Mnuchin, most of the lending programmes created during the March meltdown were not being prolonged, meaning that these are going to expire on December 31. According to Mnuchin, "[w]hile portions of economy are still severely impacted and in need of additional support, financial conditions have responded and the use of these facilities has been limited". In fact, the programmes together came nowhere close to their capacity of more than $4.5 trillion, made available by $454 billion funding from the CARES Act. Believe it or not, the Fed only used roughly $25 billion of those funds. Albeit having a negative response, the markets seemed to be indifferent to this declaration. In the realm of stocks, even though it budged 200 points on the news, the Dow Jones, along with the other main indices, is still on an upward path. The Fed, au contraire, is at odds with the Treasury. "The Federal Reserve would prefer that the full suite of emergency facilities established during the coronavirus pandemic continue to serve their important role as a backstop for our still-strained and vulnerable economy", claimed the central bank. Curiously, this denotes a more meaningful discord in the way these two entities assess the state and trajectory of the economy and the financial conditions. While the Treasury is feeling sanguine on the recovery, the Fed has been apprehensive, to be generous, after having gone through some soul-searching - this topic demands a post or more on its own. Accordingly, Jay Powell and other members of the FOMC have been expressing their concerns about the health of the economy, having even gone to Congress to call for more stimulus: "Further [economic] support is likely to be needed to avoid further spread of the virus and help individuals who, with the expiration of the CARES Act payments, are seeing their savings dwindle". The FOMC, in its official statement, reasoned their stance by claiming that "the economy will depend significantly on the course of the virus" and that the kung-flu crisis - more like the paranoia around it - "will continue to weigh on economic activity, employment, and inflation in the near term, and poses considerable risks to the economic outlook". Nevertheless, the financial markets, which are today's matter of discussion, are ostensibly all on the Treasury team, but one. Having read the first two instalments of this series, you should have no problem figuring out which market, or market category, is the outlier. Unsurprisingly, the sovereign bond markets, represented here by the 10-year JGB (blue), bund (red) and UST, are implying what the market-based inflation indicators (breakevens and swap spreads), and even the ZEW survey in Germany, have already shown us. As I have finished part two off by mentioning the rebound left its mark on two points in time. To wit, the beginning of June was the first and the second lie at the end of August and the dawn of September. By the same token that Germany and Japan act as bellwethers for the global economy, their own government bonds seem to act like one as well. The UST, though, is on la-la land. However, it did not start out this way. On June 5, all of these three markets realised the economy comeback was losing some steam. Up until early August, they were signaling a slowdown, especially the UST. Then, in spite of financial conditions apparently beginning to get looser till the end of that month, the 27th, they once again recognised deflation, or disinflation at best, was the economy's fate. Interestingly, by the time October arrived, the UST inaugurated a decoupling from the other two, by and large compared to the bund, despite the vaccine breakthrough making the impression that they were going to move together to the good side, upwardly. Although it now seems they are on the same path, it is unfortunately on the bad, downwards one. 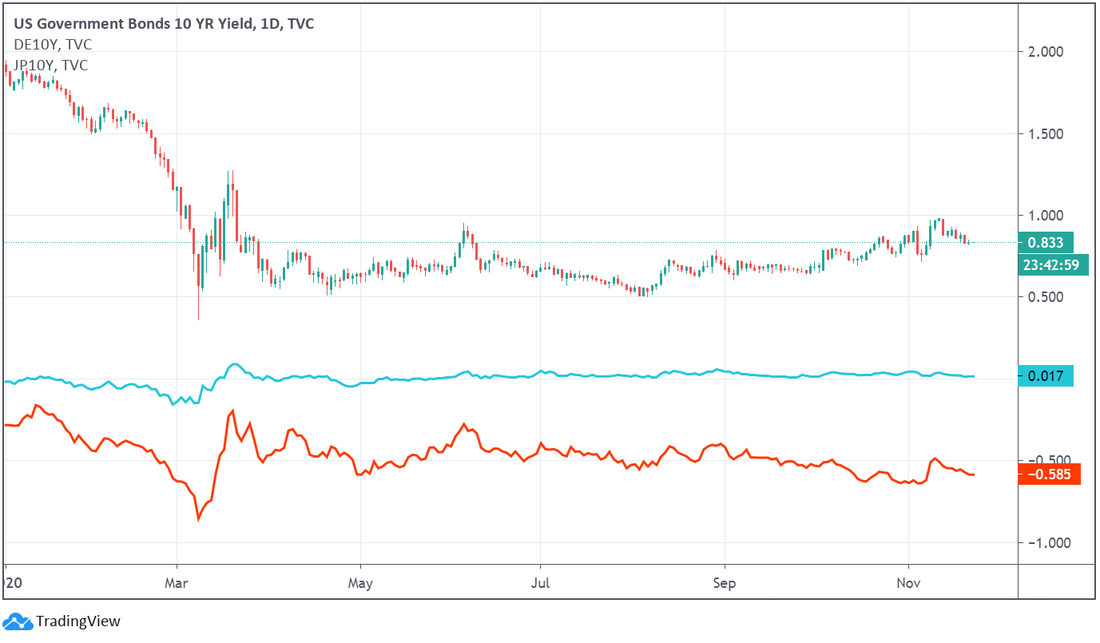 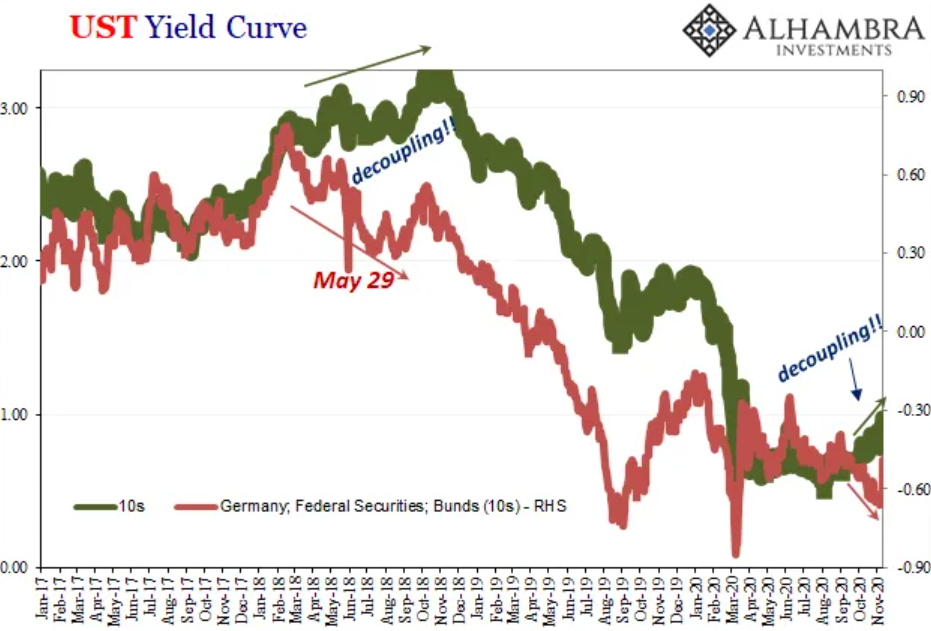 As the graph above shows, this oddity had teased the decoupling cheerleaders from May 2018 up to late October/early November. Owing to participating in a global economy, with its foundations on a border-less monetary system, every country or bloc, sooner or later, feels the monetary drought or bonanza of the eurodollar system, making the decoupling an absolute fantasy. In the same way that the last one lasted around 5 months, this one will most likely be as or even more ephemeral. Granted that this one is currently approaching its third month, because of all of the data exposed in this series I am inclined to believe the decoupling mirage has already vanished. Moving on to another market indicator of the economic panorama, as well as probably reflecting most accurately the level of economic activity, the oil market tells the exact same story as the bond market. Once restrictions were lifted as April came to an end and May kicked off, prices soared (resembling the right side of the "V" - hurray!) until June 5, rising languidly till August 26 (which happens to be the day before the 2020 Jackson Hole Economic Policy Symposium commenced). Afterwards, oil prices embarked on a downward course until the eve of the Election (Fraud) Day, November 2, when it returned once more to the bullish mode driven by Sleepy Joe's alleged victory and then getting hit by the vaccine news the following Monday. Clearly, the effect of this factor duo is still lasting to this day in the oil market... 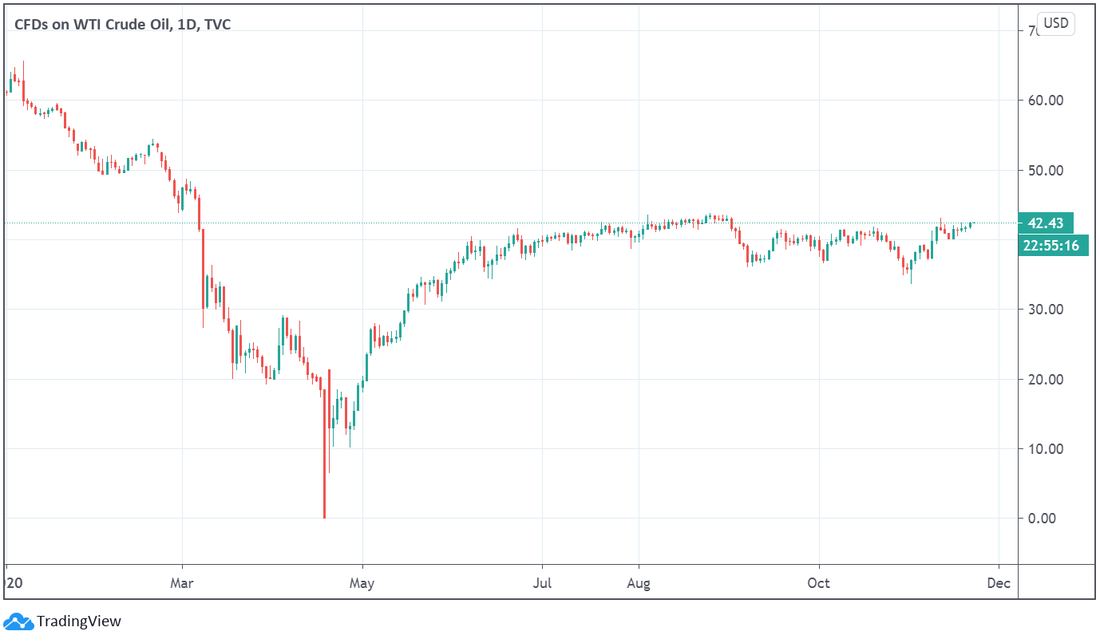 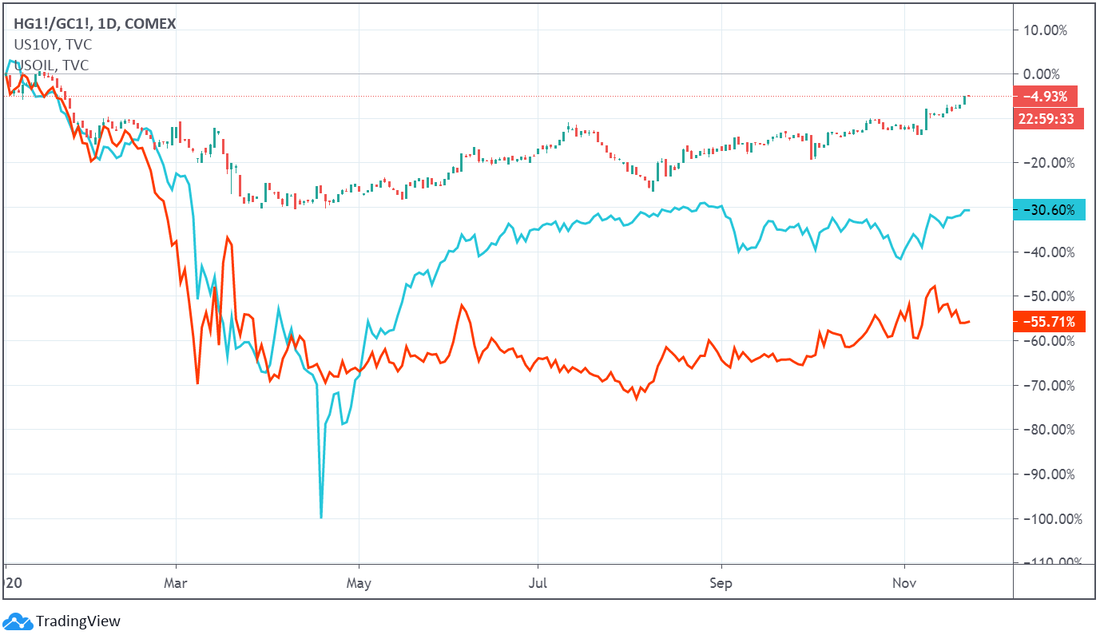 ...in addition to the rest of the commodities domain. Above, it is depicted the 10-year Treasury yield (red), the WTI oil (blue) and the copper-to-gold ratio normalised to December 31 of 2019. Looking at the chart above, it is obvious the copper-to-gold ratio is significantly diverged from the 10-year UST, even more so than oil is. It resembles what was occurring in July when the two were going in opposite direction. Despite that, he ratio then started to follow the bond yield. In view of Treasury securities being the adults in the room, this ratio and oil too will certainly tread on the heels of the 10-year Treasury. Furthermore, the dollar, either via the DXY or the trade-weighted indexes, is suggesting the rebound has hit a wall since the onset of September, and neither the anointed President nor the vaccine news were able to convince market participants that reflation is on the cards. Just to keep the consistency, indulge me one more time. Firstly, financial woes eased rapidly, when lockdowns were put to an end in May, until June 10, having the dollar distress returned again at the Q2 quarter-end bottleneck. Secondly, after that seasonal phenomenon, the dollar resumed its decline till September 1, having since traded sideways.
Finally, turning our attention to the market that everyone pays attention to, there are no reasons to be chirpy. Obviously, I am referring to the stock market, not just in the US, but in the world as a whole. Be that as it may, let us first focus on the States. On the graph below, the main American stock indices are pictured: the Dow Jones (blue), the Nasdaq 100 (red), the Russell 2000 (yellow) and, the main feature, the S&P 500. Once again, and I hope this does not bore you (so I will save the details for you to do), these indices are demonstrating the reflation optimism exhausted completely by the arrival of September. Notwithstanding, after dropping gently up to the day "the most extensive and inclusive voter fraud organization in the history of American politics" took place, stocks have had a big-stimulus-hope-plus-vaccine-news-induced rally. As you can see, the small caps (Russell) have been the highlight. Due to the development of the vaccines, market participants are expecting life to go to normal - the old mask-free, less totalitarian and insane one. Hence, there has been a rotation from the stay-at-home trade to the reopening one, which results in getting rid of some tech stocks (Nasdaq) and, in turn, acquiring pretty much every other group of stocks. Therefore, it should surprise nobody the Russell 2000 has reached a new record high, with the Dow Jones being on the verge of reaching the 30,000 points landmark. 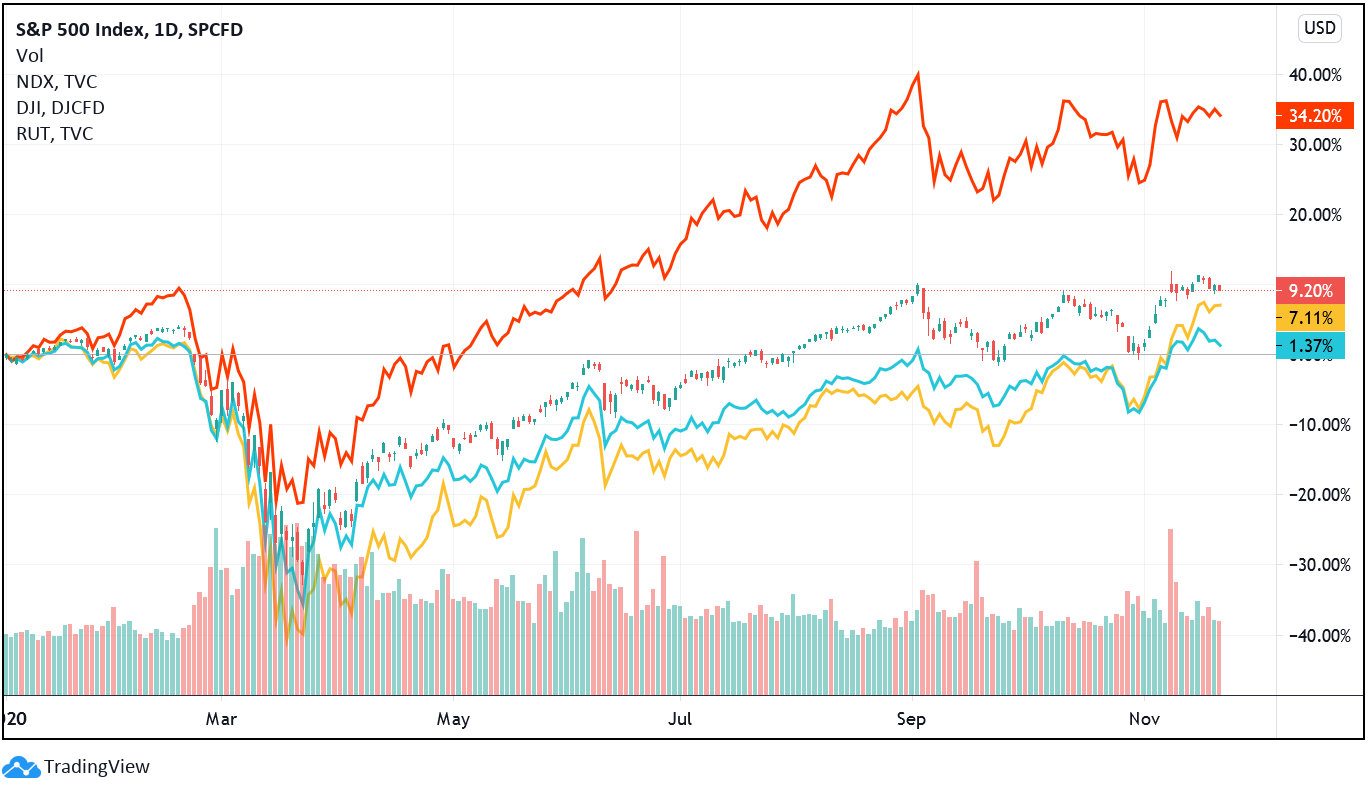 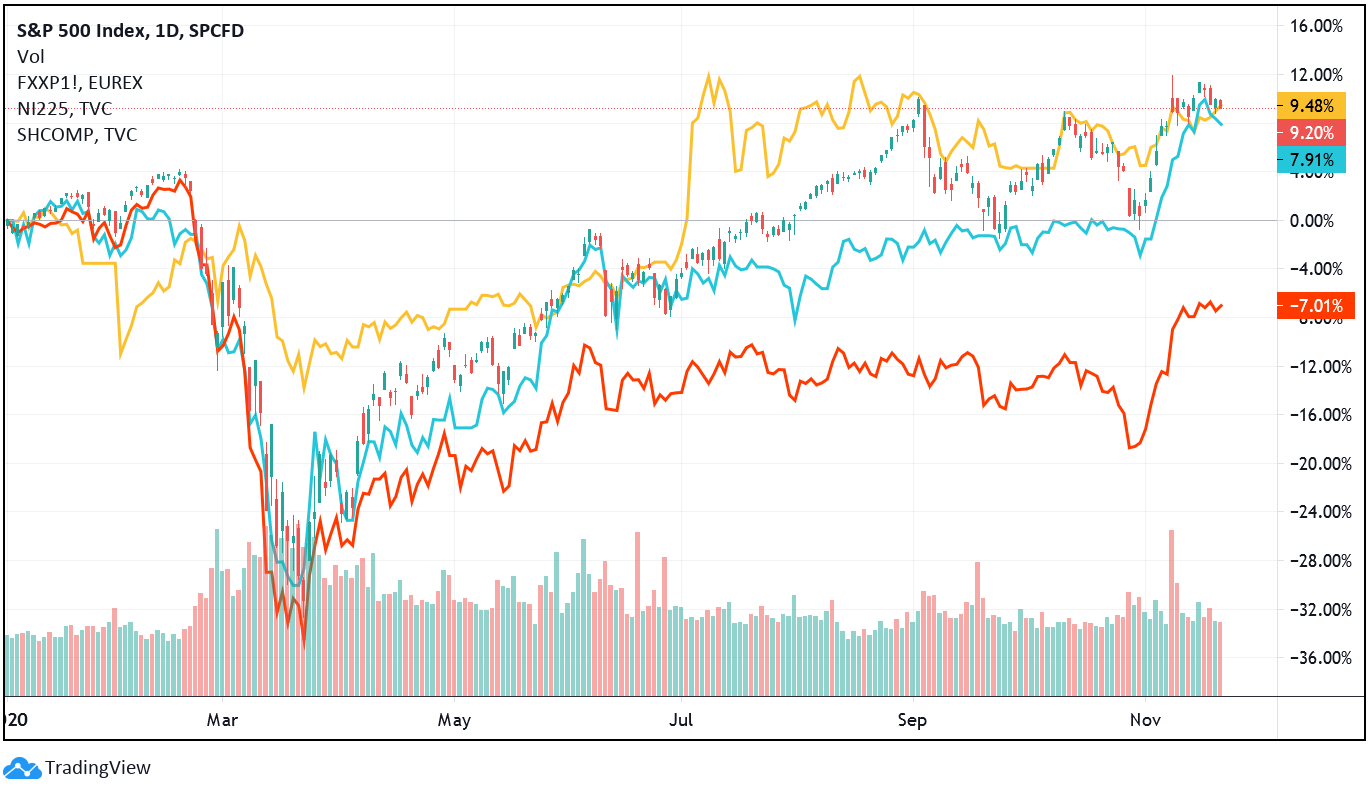 Reviving the countries/regions featured on the previous chapters, the US, Europe, China and Japan, let's take a look at the performance of their stock markets. On the chart above, for the US we have the S&P 500, for Europe we have the STOXX Europe 600 futures (red), for China we have the Shanghai Composite (yellow) and for Japan we have the Nikkei 225 (blue). Starting on the Far-East, from June to November 3, the Nikkei traded sideways on a very tight range, shooting up thereafter. Similarly, the Shanghai Composite climbed till July and has remained at the same level since. On Europe, however, the prospects have been even bleaker than in Japan, with the Biden-Pfizer-Moderna combo saving the European stocks from further decline, though the broad market is still very much negative so far this year. Moreover, breaking the global stock market down in three regions, the US, DM excluding the US and the EM. For the US we have the Russell 3000 - it is a market-capitalisation-weighted equity index that tracks the performance of the 3,000 largest U.S.-traded stocks and serves as a building block for a broad range of financial products which include the large-cap Russell 1000 and the small-cap Russell 2000 index -, for the DM ex-US we have the Vanguard FTSE Developed Markets ETF (red) - it tracks a market-cap weighted index of large-, mid- and small-cap stocks from developed markets outside the US; 3,977 in holdings -, and for the EM we have the iShares MSCI Emerging Markets ETF (blue) - it seeks to track the investment results of an index composed of large- and mid-cap emerging market equities; 1,212 in holdings. As before, European stocks, which make out the big majority of the this ETF, was obviously saved by all of the recent developments. In spite of turning positive for the year, it is still far from the US and the EM bloc (of which China has a huge influence). 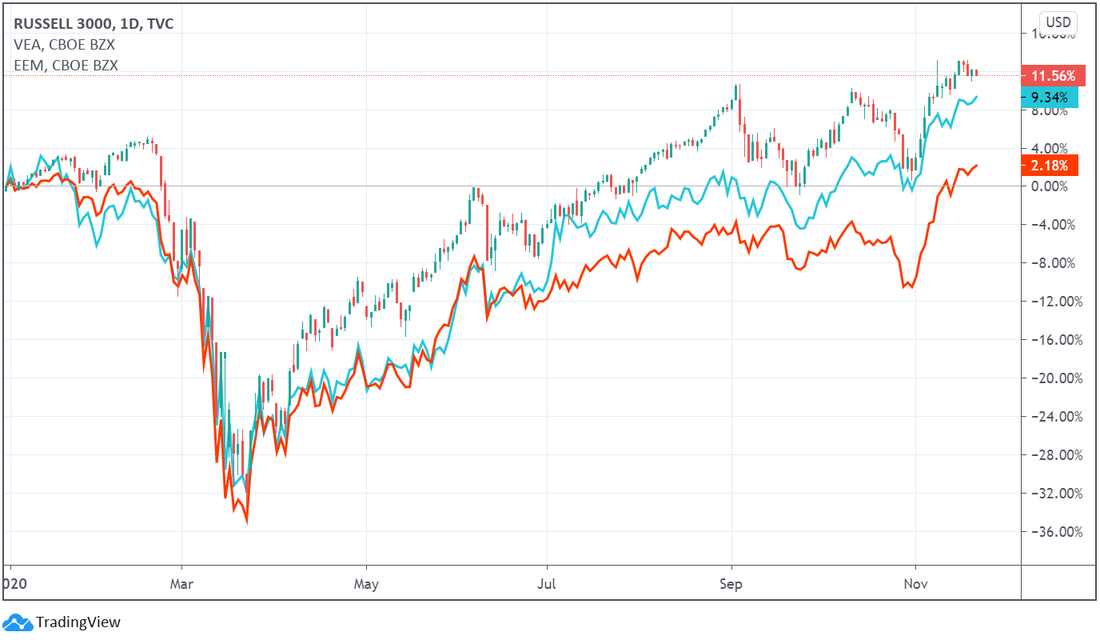 To conclude, the only question left to answer is whether or not this recent optimism, or euphoria rather, is justified. Unfortunately for the economy and the financial markets, there has to be more than hope and wishful thinking so as to have the much-anticipated reflationary recovery.
When bearing in mind all of the recent bullish developments, the US election results and the vaccines, it is no surprise there has been this rotation towards the reflation trade. Of course, one would only assume this if he is guided by faith in the governments' and central banks' stimulus fairytales, plus the hype and reassurance coming from the financial press and "gurus", and would have to ignore everything else I showed here in addition to the roadblocks that are fast-approaching, like the expiration of the moratoriums and of the federal jobless compensation schemes. Which market do you think is more reliable? That historically has been more on the money (or lack of it)? Undoubtedly, the bond market, either the UST or the bund, is the more truthful. Regardless of the present stock market inebriation, they will ultimately join the bond's monetary hangover.
0 Comments
Leave a Reply. |
AuthorDaniel Gomes Luís Archives
March 2024
Categories |
 RSS Feed
