|
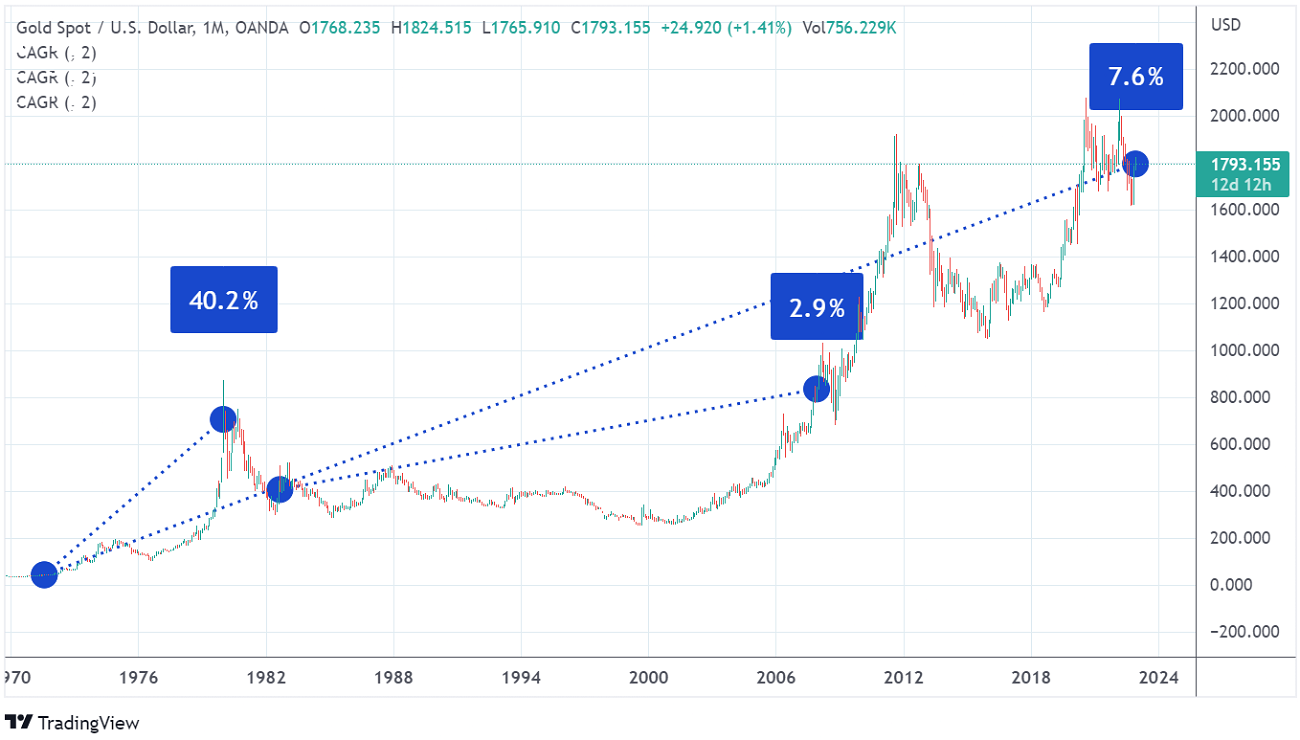
Continuing the perusal set off on the first episode of this second instalment of this three-part series, I am going to focus on the factors determining the price of gold in this post-BW eurodollar paradigm. After showing how the gold market is structured, in terms of the various venues, the different asset classes and the paper vs physical markets dichotomy, I am now going to demonstrate how exactly the Eurodollar beasts affect the gold price. As I mentioned at the end of Part I, the heart of the matter is the London Gold Lending Market, where bullion and central banks gather to carry out gold lending and gold swap activities. Due to these operations being very opaque and secretive, who is actually participating and how much true gold, in lieu of the paper “synthetic” kind, is being submitted in these trades are big unknowns. Be that as it may, that does not stop or prevent us from figuring out and inspecting the determinants governing the performance of gold throughout time. Having said this, there are three facets that, so as to become discernible, depend on the time interval. On that account, I take the view the analysis ought to be divided into the long, the medium and the short terms, with each stretch possessing a unique factor. Starting with the longest term, in the long run, inflation – the real one, without the quotation marks – has been the most obvious influence. Despite the common belief nowadays that the price of gold has failed to keep up with the rate of price surges because of the compelling credibility of central banks, with some even disregarding inflation altogether, the truth is that gold has played its role of inflation hedge pretty well since President Nixon put the final nail in the coffin of Bretton Woods. 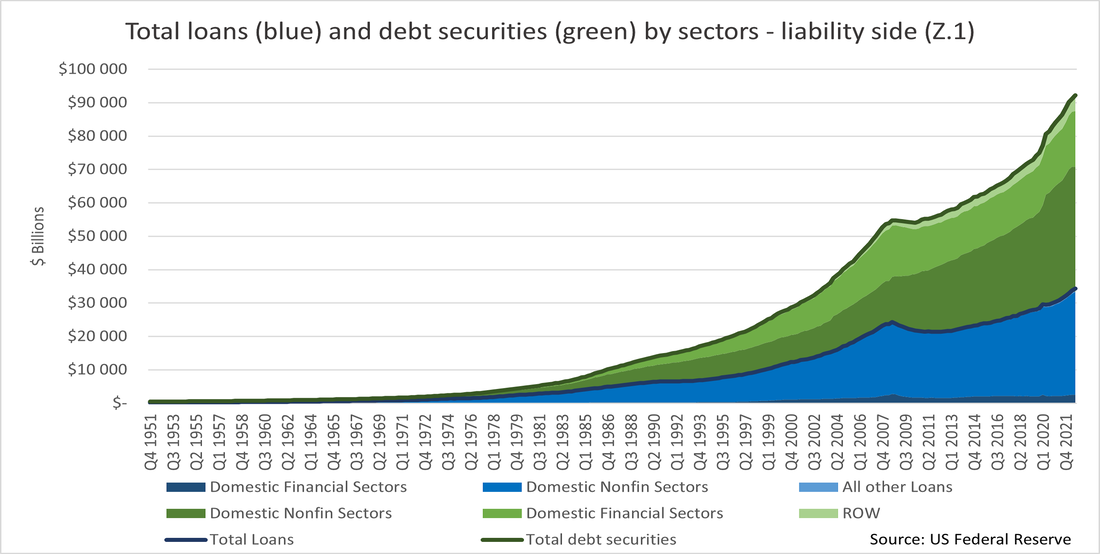 Using the Fed’s Financial Accounts (Z.1) data as a proxy for the whole world, we can easily discern that gold has done its job. Albeit far from being a perfect method, it is better to just stick to the US. In fact, the global aggregate data of credit to the non-financial sector has only been collected by the Bank for International Settlements (BIS) since the fourth quarter of 2001; not to mention the debt securities figures which ignore the Emerging Market countries completely. Besides, the American economy may be viewed as a representative sample of the global economy, owing to being a mean, between the blossoming, jovial developing countries, and the stagnant, decrepit European and Japanese markets. Thus, from the moment the convertibility to gold was terminated, total credit of US origin (chart above) has had a compounded annual growth rate (CAGR) of about 8.25% (from Q3 1971 to Q3 2022). Comparing to gold’s performance, beginning in August 1971 and up to December 16, 2022, its CAGR amounts to 7.6% (next graph on the left). Hence, judging solely from these statistics, one can claim that gold is a tiny bit undervalued. Examining the following graphs further, clearly the price of gold does not track the expansion of debt, which has been smooth and relentless, though with an important inflection caused by the GFC. Ostensibly, it has its own boom and bust cycles.
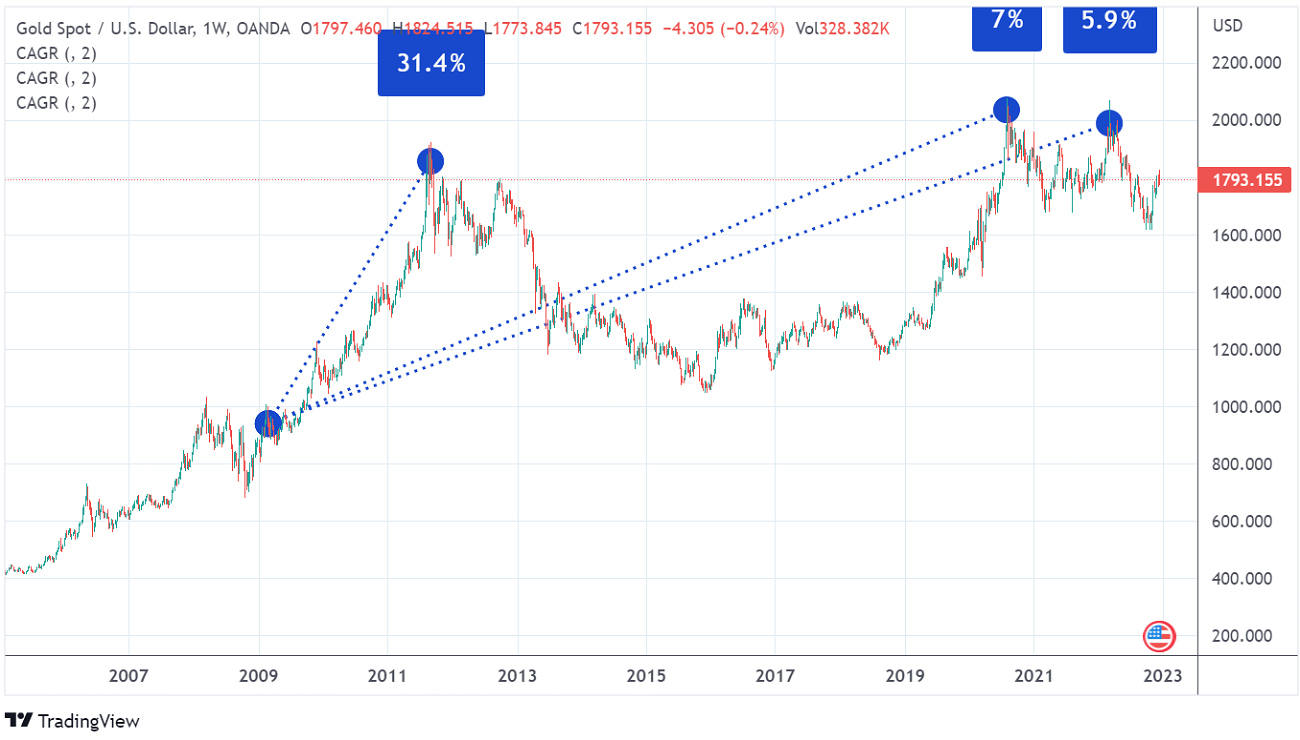
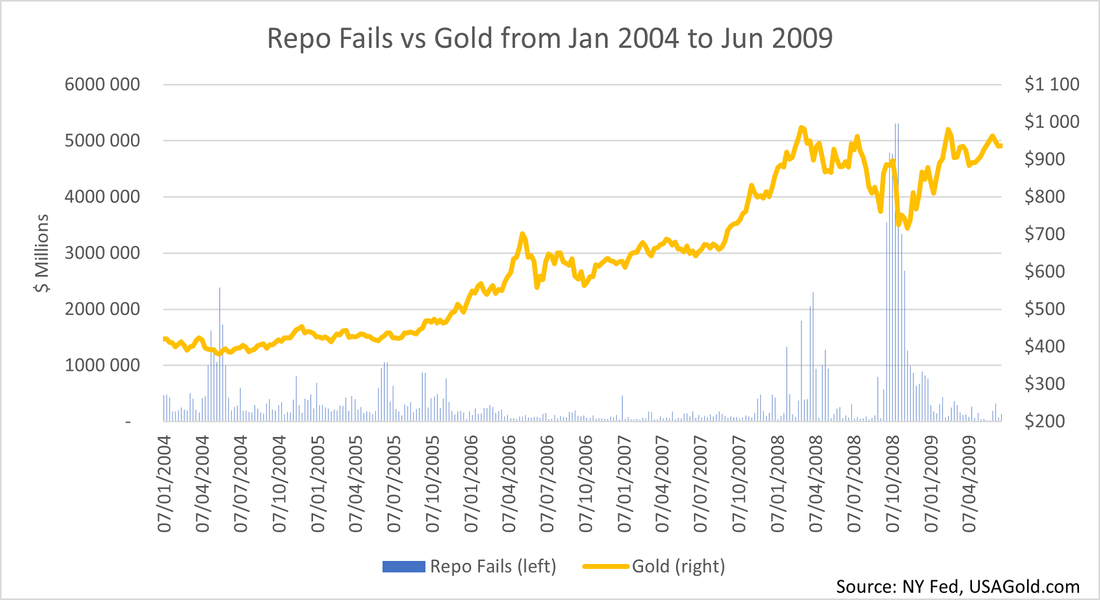
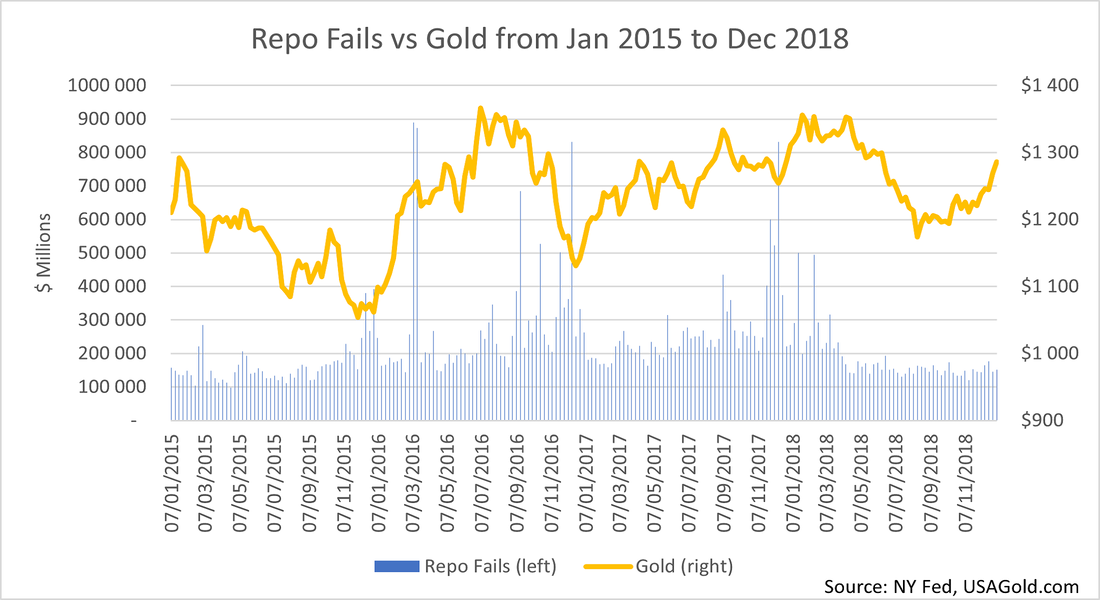
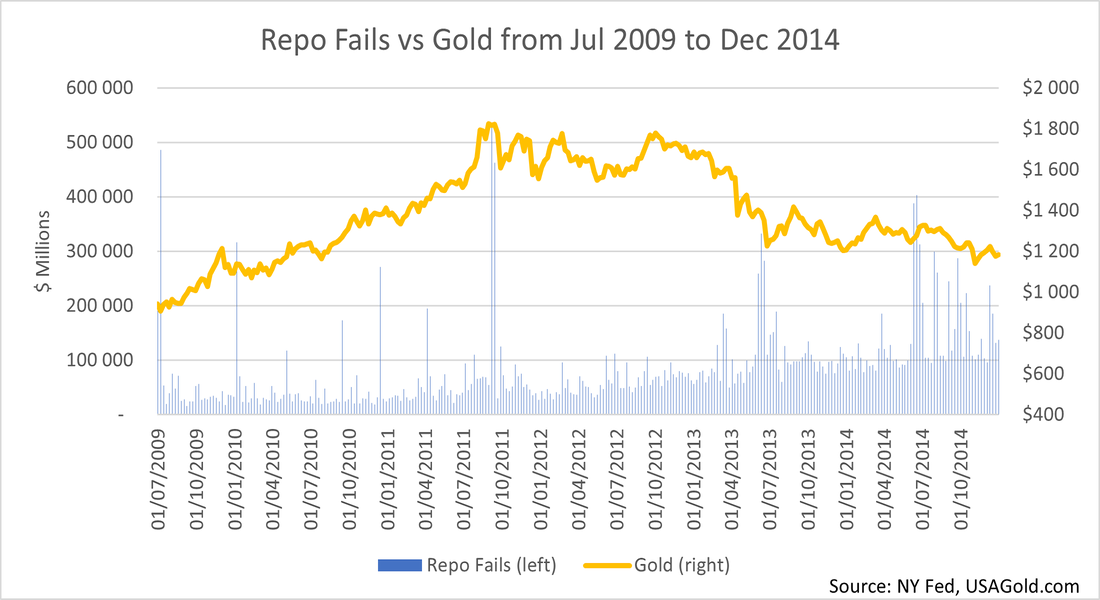
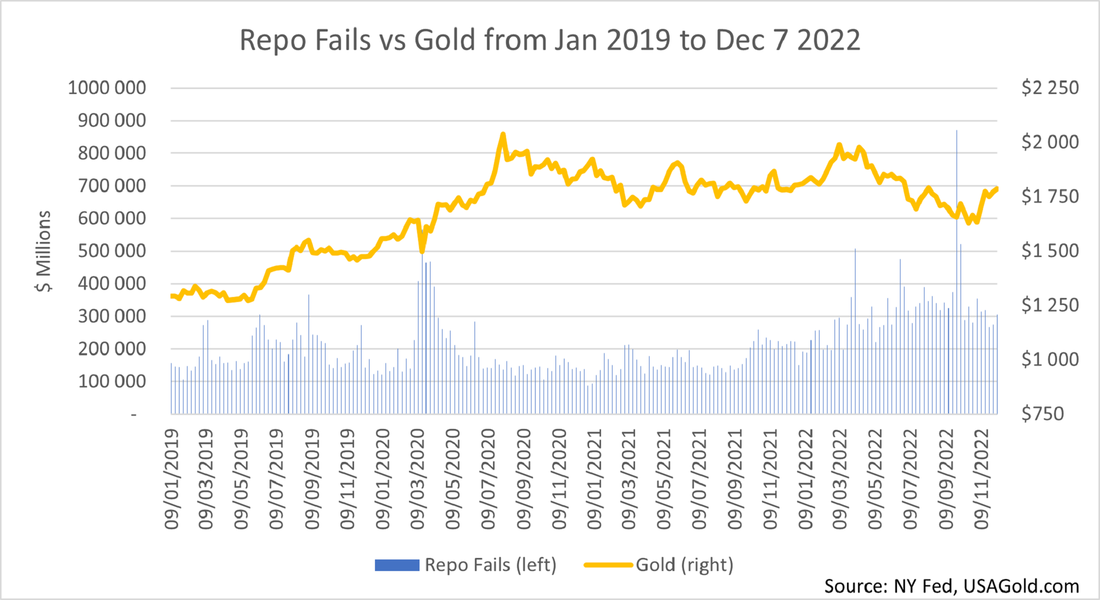
During the Great Inflation, gold’s CAGR was 40.2%. In turn, total credit (in the US) ballooned on average 11.79% annually. Then, at the time debt was increasing at an annual average of 9.20%, which became known as the Great Moderation – from Q1 1982 to Q4 2007 –, gold grew at a rate of just 2.9%. Moreover, at the aftermath of the GFC, starting in the winter of 2009 and ending in the summer of 2011, the yearly pace of credit expansion was merely 0.69%, while the corresponding figure for gold was a gigantic 31.4%. At last, keeping the Q1 2009 as the base, until Q3 2020, when gold reached its all-time high, its CAGR came to 7%, and until the recent local maximum reached in March of this year, this statistic added up to 5.9%. In comparison, respectively to those same intervals, debt accrued 3.54% and 3.94%. In the end, it is unquestionable that inflation does not explain by itself alone the ebbs and flows of the price of gold. Nevertheless, in the long run, the gold price ultimately catches up to the profligate behaviour of the economic agents. Therefore, this raises the question of what then has a more impactful sway on gold in a more direct fashion. By and large, the answer is the investors’ expectations for the average yield of the risk-free assets, adjusted for inflation of course, in the near, foreseeable future. Applying this to the actual world, the main determinant in the medium term is the real yield of the 10-year US Treasury note, which trades with the label TIPS (Treasury Inflation-Protected Securities). Unsurprisingly, this is no accident. Insofar as Treasuries are the most liquid assets in the world, they possess the most “pristine” characteristics in collateral terms, rendering them the safest financial instruments and, consequently, the risk-free asset class. 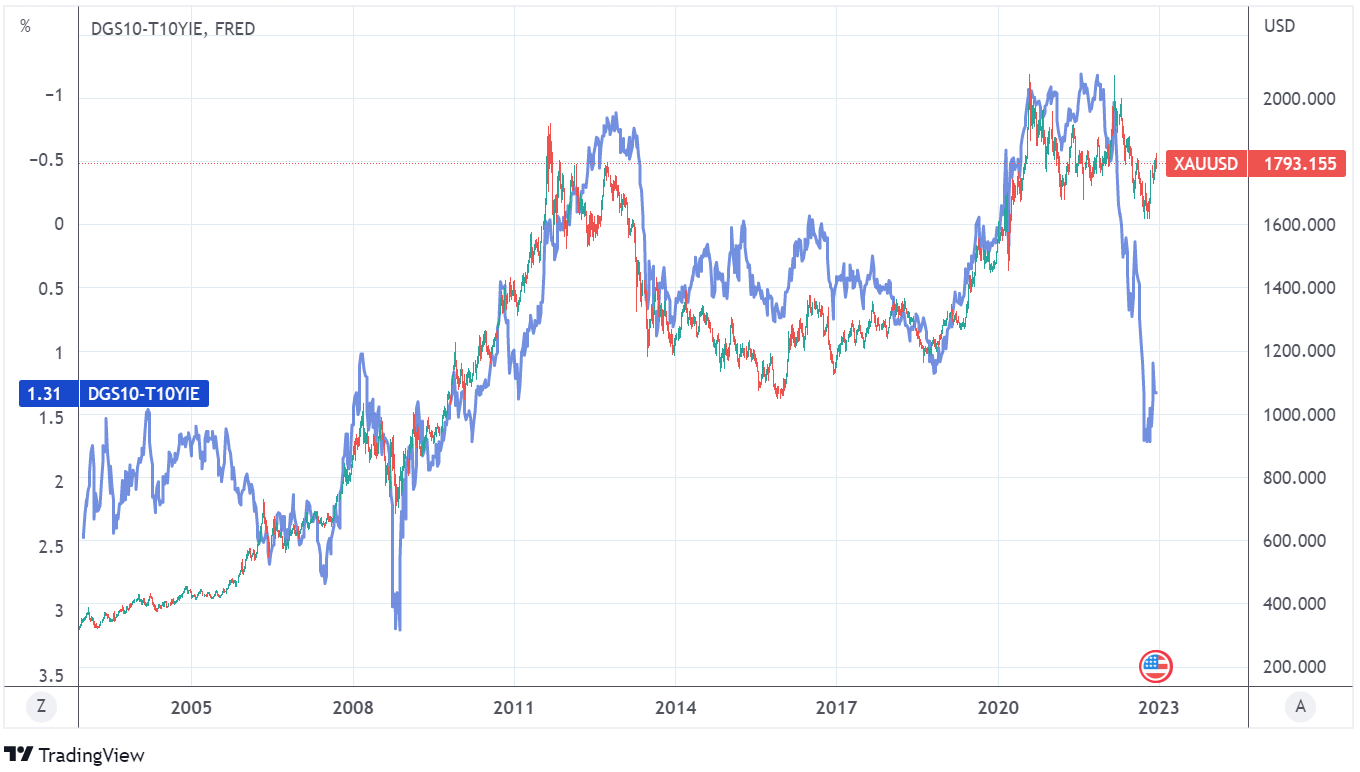 Even though the 5-year tenor could be used too, the 10-year maturity is the benchmark and, therefore, it carries the most liquidity of all the Treasury notes and bonds. As a result, the longer note presents the most precise depiction of current events and accurate representation of the market expectations. As the previous chart suggests, as speculation for weaker growth intensifies, gold becomes more attractive. In detail, the real interest rate is the average rate of return, adjusting for inflation, that investors are expecting to see in their investments in the predictable future. Typified by the yield of the 10-year TIPS exhibited above in blue, the lower the yield goes (notice that the left scale is inverted), the higher gold appreciates. Evidently, as I thoroughly demonstrated in a previous post, the investor viewpoint is not sufficient to justify the rates of interest. In reality, the Eurodollar beasts put the liquidity risk at the helm, commanding the direction of the yields of bonds and other securities, as well as the interest rates of loans. In addition, for having not even two decades worth of data, seeing that the TIPS have only been around since 2003, we have to resort to other kinds of figures. Accordingly, we can turn to the measured “inflation” rates, instead of the expected ones employed by the TIPS. Unfortunately, this is not the correct way of calculating the real interest rates. At any rate, due to being the only alternative, it will have to do the job. Looking at the chart below, which uses the 5-year rolling average “inflation” to compute the real yield of the 10-year US Treasury note since 1805 (dark blue line), the same tendency noted before remains true. Although this is a neat and interesting graph, with a lot of good information, for the sake of argument, we can pass over the light blue line representing the federal debt to GDP ratio and focus solely on the numbers after 1970. So, remembering the gold chart displayed before, one can straightforwardly observe that the lower the real yield falls, the more does the gold price soar, and vice versa. 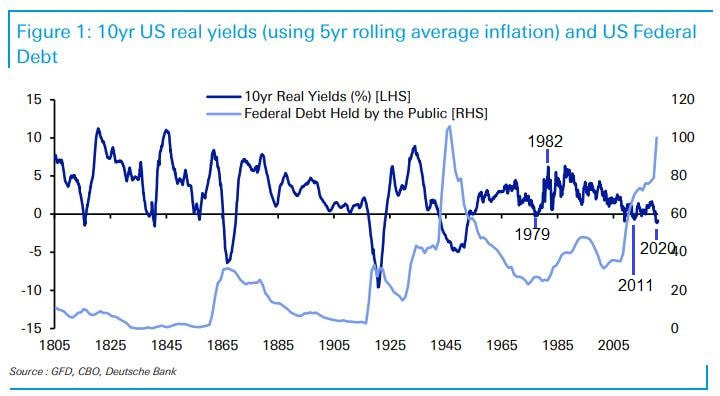 However, this too is not enough to fully describe the movements of the price of gold. As we have seen, gold has these moments when it just soars quickly and vigorously, and other periods when it collapses intensely and unexpectedly. Ergo, there is a fierce factor influencing the gold market in the short run. In spite of being rather imperceptible, I am going to reveal the most important determinant of the price of gold in the short term is the liquidity conditions in the inner workings of the global financial system, also known as the eurodollar. As the next graph shows, the relationship seems to be spurious. To be fair, it is most of the time. Notwithstanding, this relation comes to light during periods of financial distress. 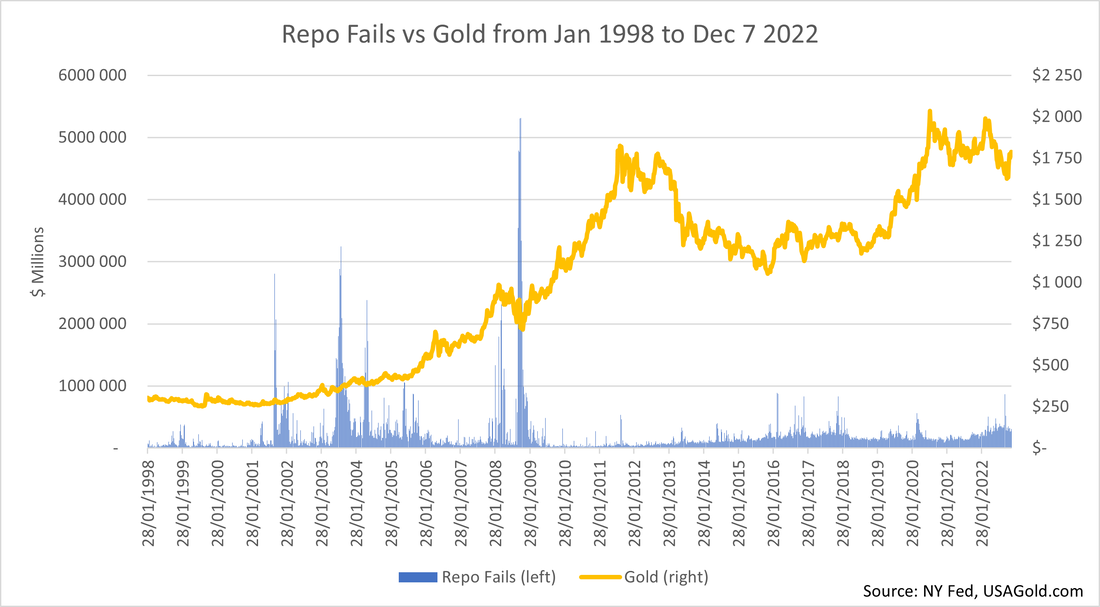 In order to explain this, I have to bring into service the gold lending and leasing and the gold swaps trading. As a matter of fact, these transactions, which I alluded to on Part I, in view of being mainly conducted with a great deal of secrecy by and assistance from the wizards in that fancy building on Threadneedle Street, in London, are without any doubt terribly misunderstood. Thus, allow me to shed some light into these shady operations. Firstly, a brief exploration of the gold swaps market. Although there had been some gold swaps that happened earlier in the 19th century, at least for the one in 1925 there is some detailed information about it. Upon reading the first chapter of this series, on the History of money, you will recognize the year 1925 for its significance. In this year, the UK went back to the gold standard after abandoning it in the beginning of the Great War. Wishing to reinstate the classic gold standard parity, Winston Churchill caused some severe strain in financial markets and in the economy. Failing to account for the wartime inflation, proved to be a horrible mistake for prompting a deflationary shock. Regardless of that, the Fed stood ready to aid its homologue across the pond, the BoE, in trying to defend the pre-war parity, despite all of those difficulties. Because there was not enough gold to support it, the attentive and sceptic market participants began to lose faith in the BoE’s ability to sustain the old parity. Ergo, so as to dupe the market, when the gold was being taken out of its vaults, the BoE had to tap into other sources of the “barbarous relic”. In this manner, one of the ways to accomplish this assignment was that gold swap, in 1925. Basically, what happened was the Federal Reserve Bank of New York, on behalf of the Federal Reserve system, made $200 mn of gold bullion available to the Bank of England for its disposal in whatever transactions it might take in defending sterling at that pre-war parity price. In accounting terms, this meant that the BoE took those $200 mn in gold then sell them in the market for sterling at the price that it wished to defend. Subsequently, they put the sterling currency into an account in London on behalf of the Federal Reserve Bank of New York. Hence, what really happened was gold disappeared from New York and ended up as cash in the UK denomination, in London. However, for accounting purposes, the New York Fed showed a “gold receivable” where gold used to be. Simply put, what is happening is the gold is coming off the US central bank’s possession, but not off its balance sheet. All the same, in the perspective of the monetary authorities, there are legitimate reasons for it. By taking the expression “as good as gold” literally, they deem a collateralized account on behalf of a counterparty central bank as good as having gold. Due to a default from a central bank being improbable, one could make the case for this indistinction. In other words, if the New York Fed have asked for its gold back, the BoE would not refuse. 15. Central bank officials indicated that they considered information on gold loans and swaps to be highly market-sensitive, in view of the limited number of participants in such transactions. Thus, they considered that the SDDS reserves template should not require the separate disclosure of such information but should instead treat all monetary gold assets, including gold on loan or subject to swap agreements, as a single data item." In the modern conventions, that is still the case. Reading the above ruling, which was proclaimed by the International Monetary Fund (IMF) in 1999, when this question was raised, the convention states that on official reports to the IMF, central banks and other government official agencies are not required to disclose how much gold they have, as distinct from gold swaps or gold receivables. For not having to differentiate the physical from the paper gold, they can just shove it all in the same line item. Thereby, these procedures leave the public in the dark about how much gold has been swapped and how much truly remains in custody. Despite spurring a lot of interesse, I am not going to address the justifications that central bankers give to withhold this information. Instead, I am saving it for the next instalment. Be that as it may, gold swaps are operations almost exclusively restricted to central banks. Furthermore, the BIS has been a big player in gold trading activities since its inception, in 1930, with disclosures provided since 2010 showing that it has taken tonnes of gold from commercial bullion banks via swaps. Yet, this has decreased considerably in recent months. With the advent of the eurodollar regime, and really the 1980’s forward, we started to see a lot of gold lending and gold leasing. As the title of this series hints at, the financial engineering created by the Eurodollar beasts brought about several innovative instruments. Undoubtedly, gold was not spared. Judging it to be a mutually beneficial transaction, central banks as one counterparty owning gold and gold producers as the ones that go out there into the world and actually dig up the commodity from the ground, come together to participate in this gold leasing market. Having to face the prospects of falling gold prices, the gold miners are going to be interested in hedging, to lock in the price where it is. Seeing that there is a significant time lag in the process of producing gold, the desire to hedge is understandable. To wit, after gold is prospected and extracted, which is very time consuming, it still needs to be assayed, measured and, lastly, refined and purified. Only then can it be marketable and sold to bullion investors, including central banks. In a gold lease arrangement, a miner or gold producer sells forward future production to lock in whatever price, akin to hedging. In order to sell forward, the producer has to borrow existing bullion from somewhere. For a long time, the only holders of such large inventories of gold have been central banks and bullion banks. So, an increase in gold leasing dislodges formerly dormant stores of physical gold from central banks, acting as an added supply of gold onto the markets. Naturally, central and bullion banks, acting as the intermediaries, were more than happy to make their gold stores yield them a nice cashflow. Similar to this leasing arrangement, the gold lending activity functions in the same fashion. Notwithstanding, it is a purely financial affair. In a gold lending relationship, the bank uses the unallocated gold as collateral for cash (in whichever currency is needed, which is one of the appeals of using bullion for collateral). Now, the gold is in the hands of an intermediary that, apart from any haircut set with the borrower, has to protect its position from associated risks. Consequently, the cash lending bank will either sell the gold outright, since it only has to replace metal at the end of the agreement, or hedge its collateral position (based on the cost of selling futures). Like the gold swap business, the accounting rules are such that the central bank continues to “hold” gold on its books, in spite of the lending and leasing operations that moved that metal into the marketplace. Thus, the market has actual gold, albeit mostly of the paper type, sold into it while central banks report no loss of supply, under the line “Gold and Gold Receivables”. Once again, these are opaque transactions, nobody really knows what has been leased or lent out and what remains in the coffers. All in all, the reason central banks want to engage in these procedures is because gold does not pay interest. By participating in these gold market arrangements, they manage to turn what is a non-interest-bearing asset into an interest-bearing asset. Although that is not a big deal for somebody like the US Federal Reserve. For some of the smaller central banks, there are needs and requirements that mandate them to earn money on their assets. Afterall, a central bank is still a bank. As a result, it has to earn some money if it wants to at least cover its own expenses. For the gold market, the end result is exactly the same whether swapping, lending or leasing gold. It acts as an agent to disgorge previously inactive supply into the physical or paper markets, or both. Gold that was until that time sitting idle in an unallocated account has now entered the market through physical (dumping by the cash lender/collateral holder) or, most likely, paper (hedging the collateral holdings) markets. Unsurprisingly, this leads to plenty of people in the goldbug community presuming that there is a secret conspiracy of central bankers, intentionally working with one another, conspiring to suppress the gold price. Even though this would require a deep inspection, the goldbugs make a really good point. Having said that, if that is not what is happening, an explanation on some of the apparently irrational moves in gold prices is needed. For some strange reason, right around 8 o’clock in the morning, New York time, it is very common to see what some people call gold pukes. Abruptly, somebody sells hundreds or thousands of contracts all at once in the futures market. As any competent futures trader knows, those transactions happening all at once rather than gradually is going to dramatically affect the price. Surveying for a more simple, prosaic interpretation, one only needs to look at the plumbing of the financial system and understand how it runs. Going back to the arrangement between gold lending and leasing between a central bank and a mining company, there is no risk for a central bank in price. In this prosaic line of thought, there is no legitimate reason for them to take an interest in price. By its very nature, the gold lending and leasing operations have negative effects on price, without having anything to do with monetary policy of any central bank around the world. Due to dislodging previously idle, stored gold onto the marketplace, when an uptick in lending and leasing ensues, for whatever reason, it is price negative. Therefore, it has nothing to do with manipulation. Plainly, it is just the natural supply and demand mechanics of the way this eurodollar system has been constructed. As the charts below show, represented by the repo fails volume, when stress in the interbank functioning (a.k.a. the “plumbing”) intensifies, gold is negatively impacted. Weirdly, this flies in the face of most investors and observers, since the precious metal is taken for a safe-haven during times of turmoil. Nevertheless, it still fulfils this role, though the beasts of the Eurodollar apparatus get the upper hand over goldbugs in moments of severe strain.
Unmistakably, one immediately grasps that these gold pukes line up rather well with repo market fails. As a reminder, these fails are nothing more than an indication of collateral problems inside the eurodollar system. If we think about gold as it pertains to these lending and leasing businesses, it is sort of a collateralised loan where somebody can borrow a financial asset – in this case, gold sitting idle at a central bank – and use it to help alleviate a collateral shortage system wide. To recall the inner workings of this financial system, the banks and other financial entities use the wholesale interbank markets, of which the repo is the main one of the secured type (from now on used as a pars pro toto for all the secured wholesale interbanking activities), to finance their operations. Since these operations, which include all kinds of asset-backed securities and OTC products, involve massive amounts of funding and smoothly liquid markets as well, they are very dependent on counterparties. In times of anxiety, fears of counterparties failing, something that is never supposed to happen, starts to happen. Ergo, delivery failures in the repo system create an absolute crisis for a bank, where they urgently need cash, no matter what. When a financial institution with funding capacity enters this affair of lending cash against gold to another entity with funding needs, it has no interest in holding that gold. Owing to storage fees and price downside risks, the cash lender will prefer to get rid of the gold, either via OTC or futures markets. Challenging common sense, if they have no interest in acquiring gold, why would they use it then? The answer is the desperate borrower is putting gold towards the cash lender on the opposite side, frankly, because they have no other choice. A commercial bank or some other institution that is running into collateral issues in the repo market might draw from their store of gold, or whomever else’s store of gold they can find, as a last resort collateralised method to get the much-desired cash, mostly in the form of US dollars. Thus, if somebody is lending cash against gold, with the sole intention to use gold for something else, that entity has over-collateralised its lend/lease deal. For instance, say a bank is doing $100 worth of gold lending with a hedge fund, the former puts on a 10% haircut on the collateralised gold and gives the cash in return. In this scenario, seeing that the bank is over-collateralised (on account that it does not want to hold gold), there is nothing to stop it from dumping it all at once in the morning. Its only obligation in that lending contract is to return some form of gold, either physical or paper, at some future date, to the hedge fund. In essence, the bank does not care what the price is, merely moving on from the gold completely. Succinctly, the more the repo market system is stressed in terms of a collateral shortage, the more people must appeal to last resort alternatives, including gold. This means the amount of gold lending (dislodging previously stored-up and off-market supply of metal – both paper and physical) jumps. As a result, owing to the connection between funding market illiquidity and collateral issues, the gold price ultimately tumbles precipitously, seemingly, out of nowhere. Taking the following graph into consideration, one immediately realises that there is some significant correlation between the BoE gold holdings and the price of gold. Despite not always signifying causation, I think we can confidently claim there is some degree of it. Except, it is not in the causal direction most goldbugs surmise. 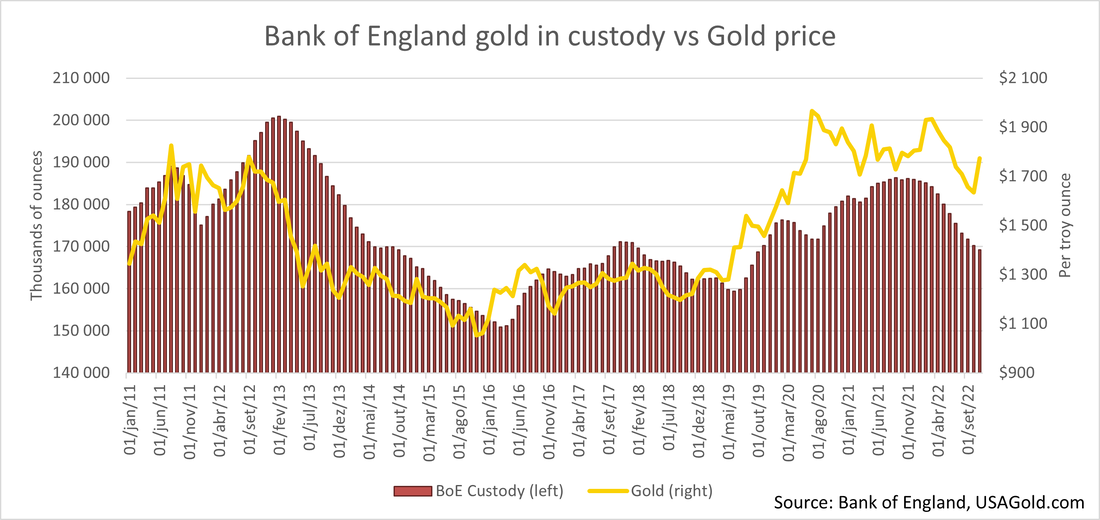 Indeed, bearing in mind all the reasoning presented above, it is not the English central bank that manipulates the price of this “relic” by flooding the market with its vast reserves of gold. Afterall, the BoE is the second biggest custodian of the precious metal worldwide, only bested by the New York Fed. Au contraire, the inventory of gold in the BoE simply follows the lead set by the metal.
To be more precise, it is heavily influenced by the liquidity conditions of the financial structure. When the Eurodollar beasts are becoming increasingly distressed, gold attracts more demand, resulting in higher prices. Before we go any further, let me remind you that the BoE gold holdings are not just its own, but belong to other central banks and bullion banks too. With this said, as the interest in the precious metal rises, the activity in the gold market surges as well. Since it is the BoE we are examining, then it is the Loco London, OTC gold venue that is experiencing a lot of business. As I demonstrated on Part I, in all likelihood the ensuing enlargement of the gold holdings takes the form of synthetic unallocated gold. Likewise, we can assume the COMEX behaves the same way because, as I expounded on the first part, the magnitude of their fractional reserve trading is equivalent. Evidently, the more the demand for gold heightens, the more will gold, physical and paper, show up in the BoE balance sheet, akin to COMEX stocks (click on Comex Data, then Inventory Data). Chiefly, this increment in demand occurs on account of the medium term factor, the fall in real interest rates, as I have already clarified. Visibly, the same is true in reverse. In any event, the repo fails resulting in more gold lending facet is also discernible in the last chart. In periods of noticeable strain, especially financial crises such as the GFC in 2008 and the European sovereign crisis in 2011 – unfortunately, the BoE only began publishing this type of numbers in 2011, so we have no monthly data for 2008 –, the utilisation of gold as collateral, in the repo market, is multiplied. Hence, BoE gold reserves are drained pronouncedly. Nevertheless, the same did not occur in 2020. Perhaps, on account of the crushing constraint only lasting about a month, being over before the banksters managed to persuade the snail-like bureaucrats to let them exploit some of that shiny unallocated gold. In conclusion, the three paramount determinants of the price of gold are inflation, the real yield of the risk-free asset and the smoothness of the financial system. Each one has its effect perceptible on the long, the medium and the short terms, respectively. Taken together, we realise that gold resembles a volcano. After laying dormant for most of the time, it then slowly starts to move, gradually gaining momentum until it bursts to the sky. By the same token, the performance of this metal is the mirror image of an inflationary boom and bust cycle. As the booming phase of the cycle runs its course, everyone cheers the increment in economic activity, indulging on credit, while being utterly oblivious to its future inescapable collapse. Consequently, when the boom turns to bust, suddenly, the inflation becomes obvious and the statistics for labour, economic output and productivity turned out to be just an illusion. For this reason, sensing the imminent financial ruin, or feeling it even, investors and the general public to boot will seek a safe-haven. Therefore, gold always prevails in the end. On the next and final instalment, I am going to give my final remarks. In addition, I am going to take a dive into the Gold Pools and other shenanigans orchestrated by the central banks, and how it all relates.
0 Comments
Leave a Reply. |
AuthorDaniel Gomes Luís Archives
March 2024
Categories |
 RSS Feed
