|
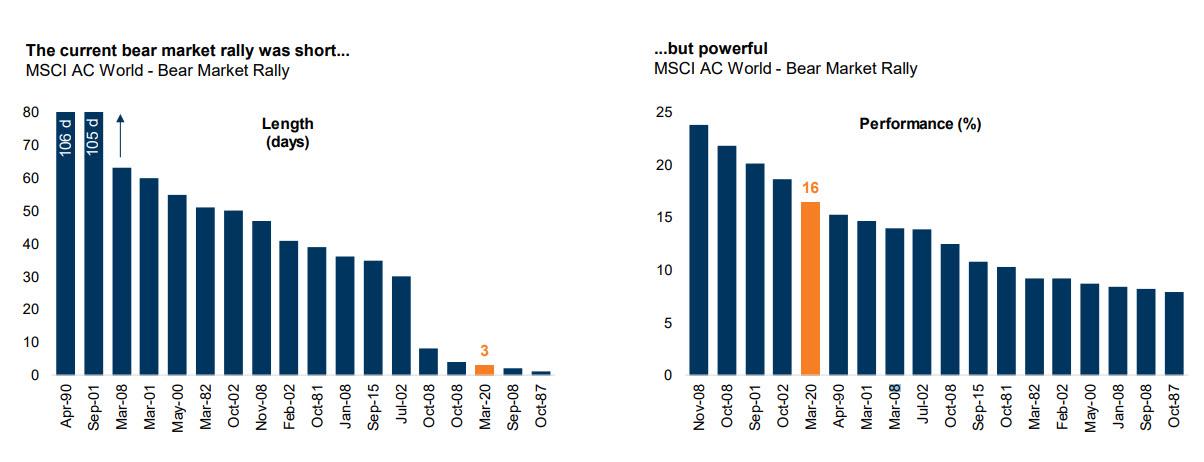
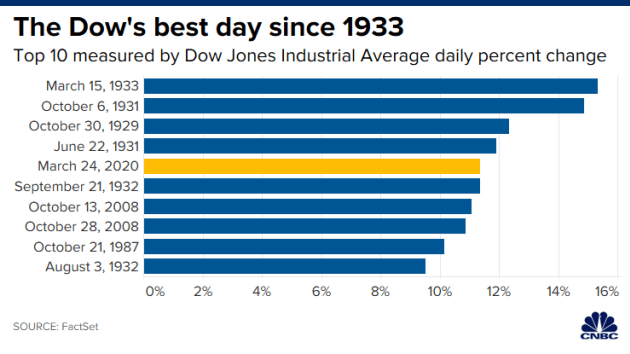
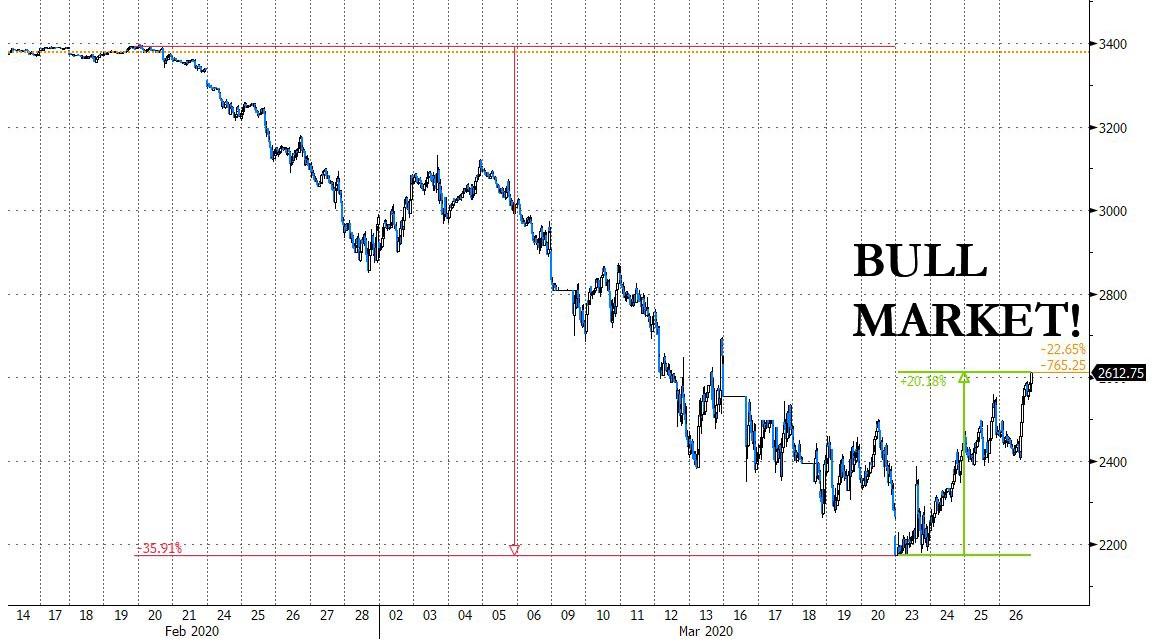
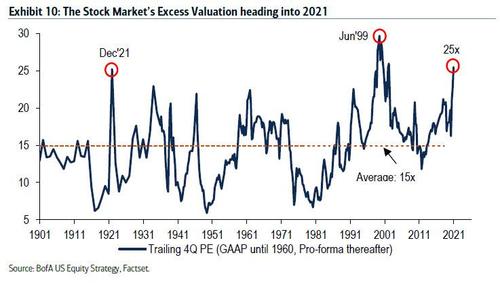
As we reach the end of this annus horribilis in which only 99.999% of the world population survived the corona-plague, the time has come to review the most noteworthy events financial- and economic-wise that took place in its span. Before we get down to business, I must warn you that this is not for those whose stomach is weak, as well as those suffering from PTSD from the dizzying trip that was 2020. Now that the disclaimer has been made, let's start. Without surprise, this was the year everybody in the world lost their minds, when paranoia over a novel influenza-like illness, which is not more lethal than the other ones, spreaded faster and more extensively than the kung-flu itself. To add insult to injury, it also brought about more death and misery, through tyrannical and short-sighted measures, than the coronavirus. In fact, scientists have recently come up with studies that reject the ill-founded belief lockdowns were necessary. For example, in one of those, they claim the "stringency of the measures settled to fight pandemia, including lockdown, did not appear to be linked with death rate". As it turns out, the researchers found that the criteria most associated with a high death rate was life expectancy, though higher COVID death rates were also observed in certain geographic regions. 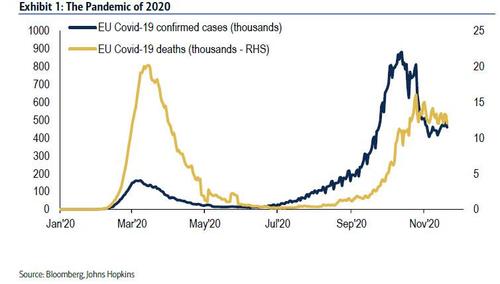 Anyway, back to the memory lane... Owing to the paranoia-induced shutdown of the global economy, the stock markets around the world had their fastest crash in modern history. For the S&P 500 to get to the 20% plunge that informaly marks the onset of a bear market, all it took was 16 (trading) days (bottom graph), on March 11. On the 22nd day, it passed the 30% drop (top graph), on March 19, stopping only on March 23, the 24th trading day. In the end, from peak to trough, the tumble on the S&P 500 was 34%. 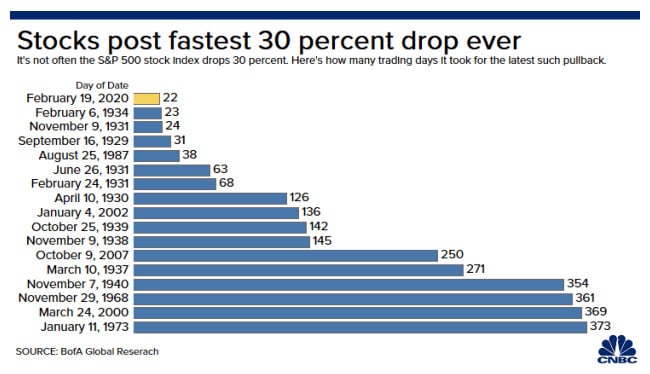 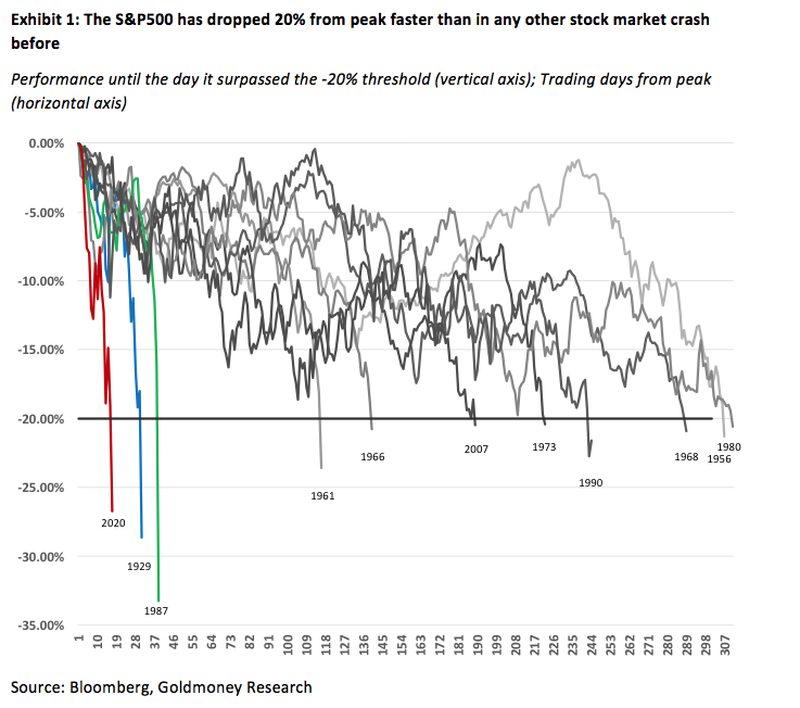 In less than one month, $30 trn had been wiped off the value of global stock markets, one of the greatest crashes of all time in both speed and magnitude - bear in mind next graph from CNBC was made in the middle of the crash, on March 14. 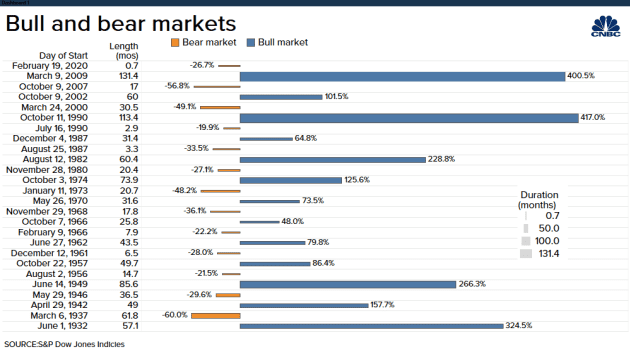 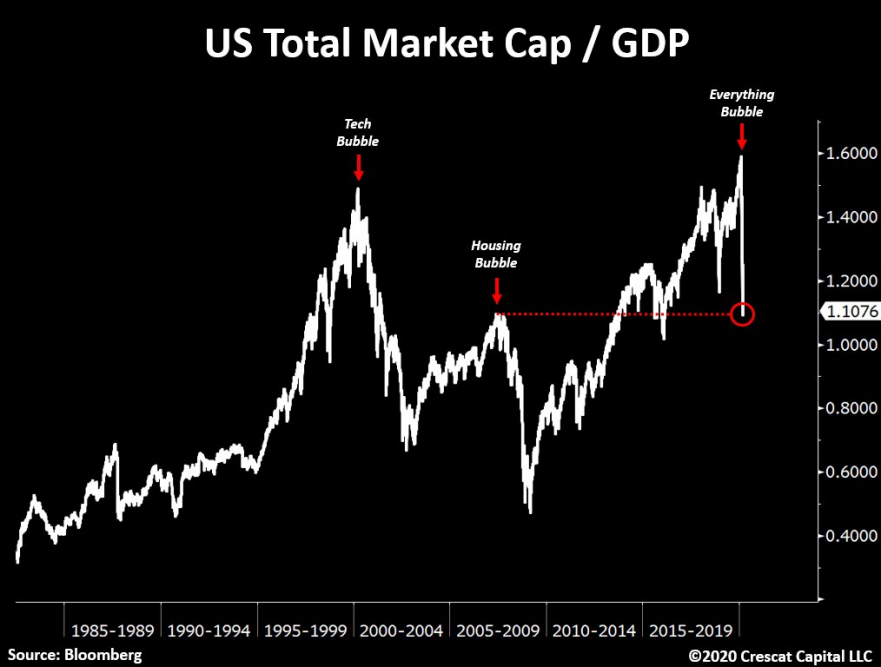 As soon as the plunging Buffet indicator (chart above depicting the ratio of the Wilshire 5000 to GDP) hit the peak preceding the GFC, stock markets roared back. The day after what turned out to be the bottom, stocks had one of their best days ever worldwide. For instance, as shown on the top left chart, the Dow Jones jacked up more than 11%. In addition, the bear market rally was so strong, in the US it turned almost instantly into a bull market. After just three days, on March 26, the S&P 500 was up more than 20% (top right chart). Likewise, the MSCI ACW index (bottom graphs), which tracks the global stocks, being a proxy for the global stock market, rose 16% in just three days.
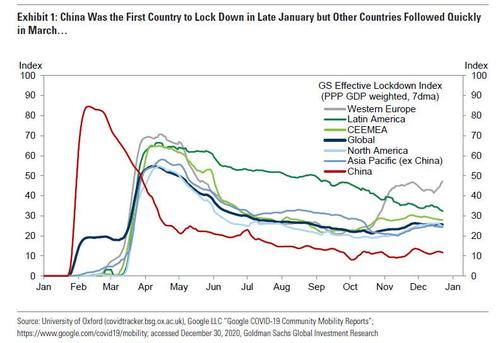
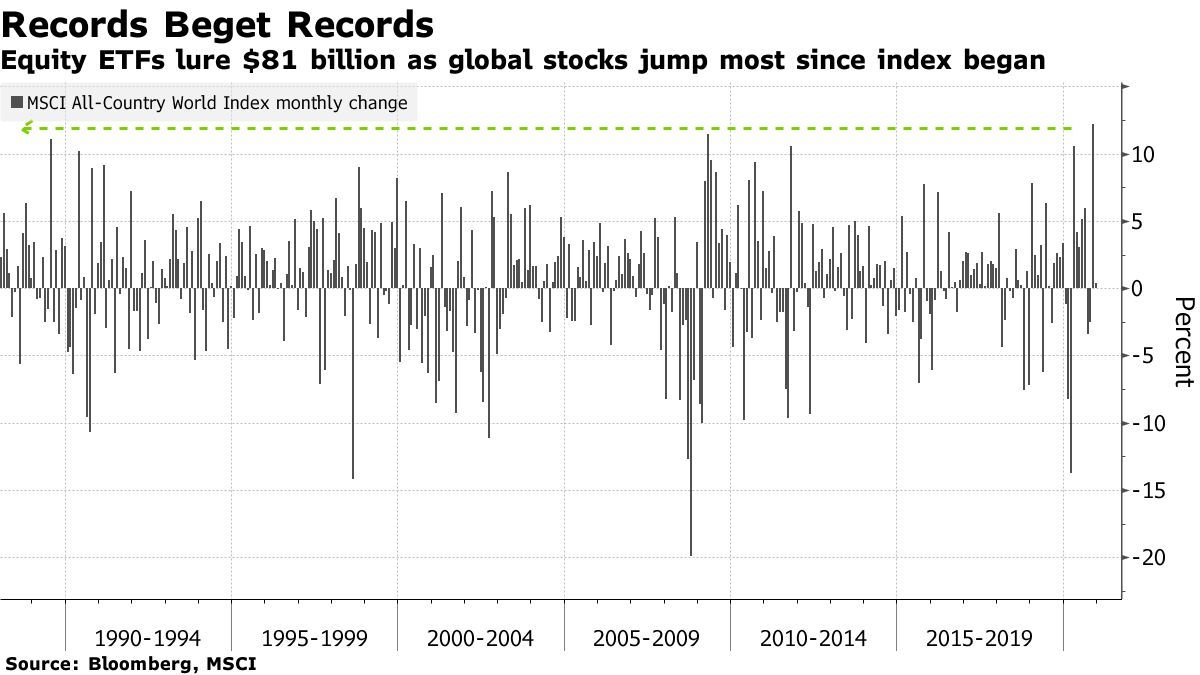
 Seeing that the economic and financial collapse was of non-economic nature (but by governments decree), soon market participants made the assumption that once the restrictions were lifted, everything was going to be fine, or even better. Thus, the global equity market cap soared by $40 trn to over $100 trn since the March lows. The rally off the trough has surpassed all of the 4 greatest rallies off the lows of the past century (1929, 1938, 1974, and 2009), with the S&P 500 climbing more than 65% from the bottom. In sum, the yearly performances, from the close on the last trading day of 2019 to this year's last trading day finale, of the various stock markets, per region, are as following: S&P 500 16.26%; Nasdaq 100 47.58%; Dow Jones 7.25%; MSCI Eurozone 5.15%; Nikkei 225 16.01%; MSCI China 26.34%; MSCI Emerging Markets 15.15%; and MSCI ACWI 14.47%. 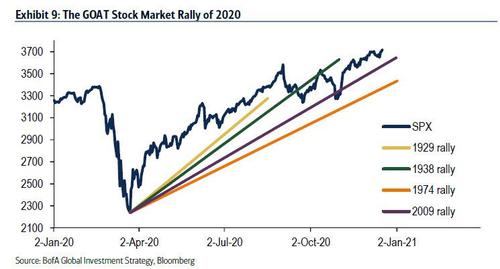 Moving on to the effect of the lockdowns in the real economy. although it was the pioneer in imposing these preposterous measures, as well as being the most stringent enforcers, China was the first country to become more lenient, still being so to this day (left graph). As a result, its economy bounced back the fastest and closer to its pre-corona-phobia level than anyone else. Recently, the regions that are feeling the brunt of the economic shutdown the hardest are Western Europe, Asia-Pacific (mostly Japan, which weighs a lot in this calculation) and North America, in this order.
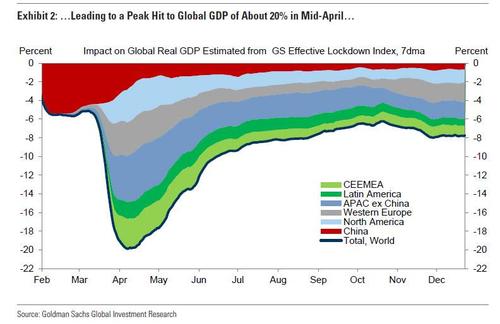
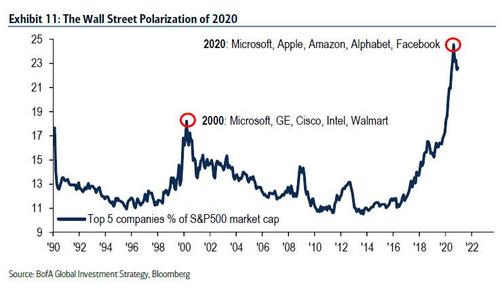
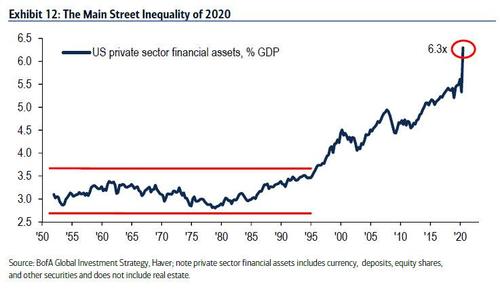
In spite of collapsing 20% in April, in round numbers, global GDP reversed rapidly, though partially, in the second half, thanks to panicked lawmakers - making them lift restrictions and provide government assistance to counter the economic turmoil and social unrest - and behavioral adaptation. Besides Chinese business confidence slumping to an all-time low, oil prices turning negative, and human "mobility" being ceased (US TSA air passengers -96% YoY in April), on account of the $10 trn wipeout in the World GDP, US unemployment rate soared to 14.7% as 70 million people filed for unemployment benefits in 2020. By the way, US household savings rate jumped to an all-time high of 34%. Other countries laws and ad hoc measures prevented (or made it less desirable for) companies from laying off workers, masking the true devastation of those countries' labour markets. 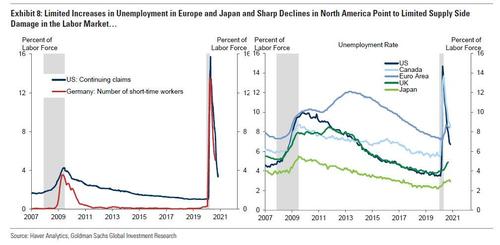 The virus, crash, lockdown and recession provoked an unprecedented monetary and fiscal policy panic. On the monetary front, $22 trn of stimulus has been announced in the past 9 months around the globe. As "fiscal stimulus" is concerned, $14 trn were announced throughout the world to stem the economic depression. Therefore, the quantity of global debt now stands at a record $277 trn. Oddly, the amount of global negative yielding debt reached a new historical figure, $18 trn, as liquidity became the number one concern. Unlike the 2008 GFC, the liquidity crisis did not (or rather has not yet) lead to a solvency crisis (top left chart). Obviously, bankruptcies have been subdued because businesses have acquired massive amounts of debt, either through bank and government loans or through the corporate bond market (like I showed in the previous post), and the imposition of debt moratoriums and other kinds of government assistance. Furthermore, the US government transferred $2 trn directly to the household sector (bottom graph) in 2020 and American consumers demonstrated how strong (or reckless) they are. However, both Wall Street and Main Street addiction to government bailouts is now habitual. 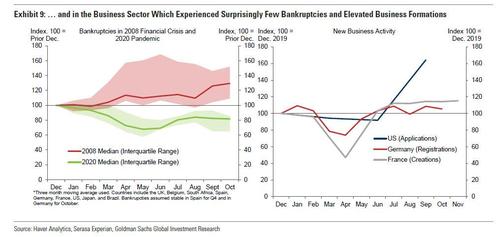 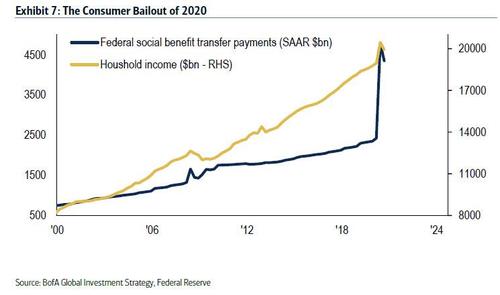 The capitulation of consensus to "don’t fight the Fed", the front-running the MMT boogeyman and the secular tech-led productivity sound like they may be some of the myriad of catalysts for more years of big equity gains. I beg to differ. Notwithstanding, Wall Street in 2020 was also marked by a significant polarisation of returns. In recent months, the top 5 companies in the S&P 500 represented a breathtaking 25% of the index (bottom left graph). What's more, owing to the euphoria surrounding the US election results and the vaccine breakthroughs, November experienced the greatest monthly gain for global stocks (top left chart). In a nutshell, due to the increased role of governments in the economy, reducing its dynamism and entrepreneurial activity, the pace at which it grows and the inclusiveness (proportion of workers/consumers/investors sharing its gains) of its development dwindle in return. As the Leviathan (government) keeps getting bigger, the less the lower echelons of society benefit from technological progress, while the top echelons acquire an even bigger share of the pie. Unsurprisingly, this year proved this with inequality cranking up. Comparing Wall Street to Main Street, the bottom right chart shows extremely well the divergence between the financial economy (easily and publicly transacted, ergo more liquid) and the real economy. Hence, in the US, the value of financial assets relative to the economy hit the all-time high of 6.3x.
No comment...  Revisiting the central banks' actions, you can see they have been very busy. Of course, everybody assumes they are relevant, very much so. The over $1 trn a month of purchses of financial assets via QE have surely precluded the implosion of the global financial system, in addition to not only prompting this unprecendented stock market rally, but also keeping yields in check. This time is for real. All that fiscal and monetary recklessness are going to precipitate the long-awaited inflation (bottom left chart). Needless to say, I would not count on it/them - check out the series about the vaccine-induced euphoria (part I, II, III and bonus). 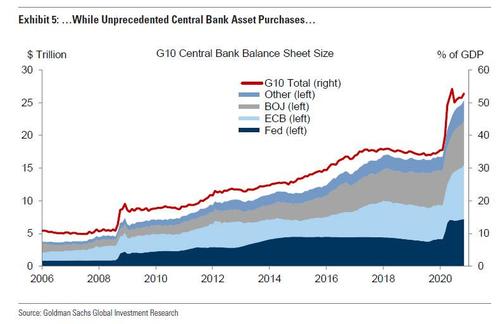 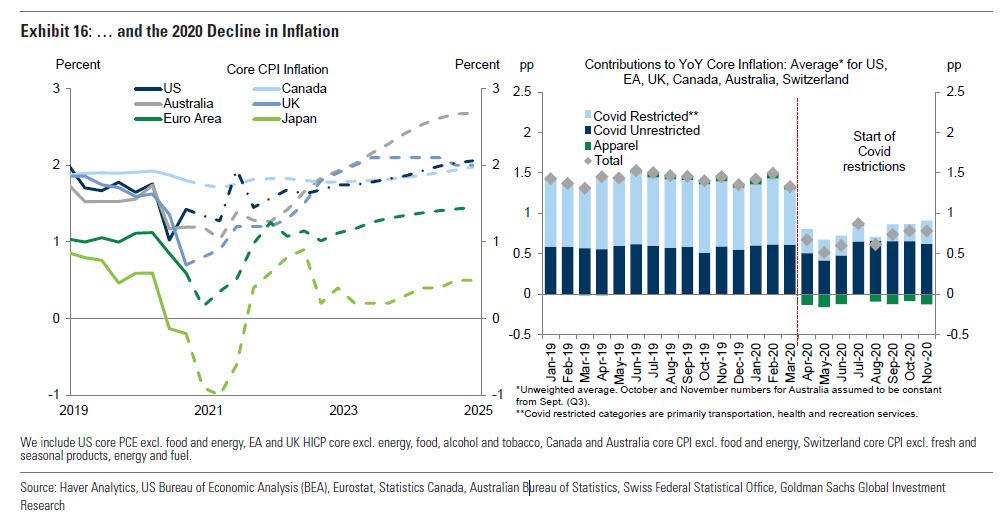 In conclusion, 2020 will, in my opinion, be remembered as the year irrationality and hysteria run supreme. Naturally, several lessons can be taken from this, and we must learn from them so as not to repeat them. For now, all I will take are some remarks. Without a shadow of a doubt, the biggest one being how willing people are to give away their liberties (even to breathe unhinderedly), while blindly trusting the authorities. Really scary stuff! Unless we go through an ideological revolution, the coming years will be marked by bigger government and central banking trickery, hopefully for nothing more than attempting to get the economy to full-employment level (whichever that one is) and "inflation" to the 2% YoY target (for whichever reason. Nevertheless, I take the view they will achieve just the opposite, while simultaneously taking away even more of our liberties and encroaching on our freedom. All the same, as it is tradition, as my solemn New Year's resolution, I promise I will continue making the effort to deliver the most coherent, data-driven and insightful commentary on the state of the economy and on financial affairs as possible. If only the (financial) media could do the same... 
0 Comments
Leave a Reply. |
AuthorDaniel Gomes Luís Archives
March 2024
Categories |
 RSS Feed
