|
Throughout the History of mankind, there have been episodes of various kinds and degrees of calamity and hardship, which inevitably caused severe torment and provoked widespread panic. Regardless of what you hear on the news or in conversations with friends and family members, Covid-19, or the kung-flu as I prefer to call it, is not one of such episodes. Notwithstanding, there has curiously been plenty of severe torment and widespread panic around this virus. Insofar as the kung-flu constitutes nothing more than another influenza-like illness (ILI), the agony and anxiety the world has been experiencing must have a source, or more, other than the virus itself. Overall, the excess mortality caused by the kung-flu (direct or indirectly) is mainly linked to the obesity levels and the aging of the populations of each country. As you can check out here, 2020 was, by and large, an outlier in terms of the mortality rate in the advanced countries of the West (Europe, North America and Australia and New Zealand). Albeit a result of several factors, it is pretty clear the overriding one is geography. Undoubtedly, neighbouring countries have had similar outcomes, with the glorified non-pharmaceutical interventions (NPIs), such as masks and lockdowns, and other measures like contact tracing and large-scale testing turning out to be a complete flop in stopping the coronavirus' advances. By implementing these measures, policy-makers were just following the advice of the presumed experts on the fields of public health, virology, epidemiology, etc. If the scientists were stating the NPIs and the like were necessary to avoid a global rampage in the scale of the Spanish flu, who the hell are you to criticise them. For one, scientists do not all agree with each other. This idea of consensus has no place in any scientific endeavour. Just because the majority defends one position, it speaks nothing to its truthfulness. Moreover, with media outlets being profit-maximising entities (i.e. businesses), they always try to engage the most viewers possible to generate as much revenue as they can get. Thus, they have long ago realised the best strategy is to entertain, not to inform. Under this entertainment umbrella, besides spinning false narratives of collusion (Russian hoax) or insurrection (Capitol "invasion"), they also produce doomsday scenarios. While climate change and extreme weather events are usually these corporations' preferred themes, the flu season provides a nice change of pace. In fact, just lask week, Jason Kilar, who is the CEO of CNN's parent company, WarnerMedia, said "the pandemic and the way that [CNN] can help inform and contextualize the pandemic, it turns out it’s really good for ratings".  In addition, as I referred on just a few paragraphs ago, the settled view on any particular matter could be completely wrong, even though it passed the scientific method's scrutiny. For a moment, try to remember the times you read a headline stating some study which claimed that a cup of coffee a day was bad for you, having a couple of days before read another headline about another study asserting that a daily dose of coffee was actually beneficial. Therefore, seeing that these two were both peer-reviewed papers, published on scientific journals, how does one know, especially a layman, which one is right? You simply have to look at the data yourself and come up with your own judgement. Unfortunately, the vast majority of the people would rather save the trouble of doing the work to stay informed, bestowing their independent reasoning faculties to those in the seats of power. Whether this makes me cynical or not, the harsh reality is that politicians are only going to hear and do what makes them more popular so as to stay in power. As a result, in times like these, our rulers are going to put forward policies that, in lieu of being aimed at solving or mitigating the situation, it has the intent to lionise them as heroes. This is not to say that they never try to provide solutions to problems, it just means that making themselves look like heroes is the top priority. In plain and simple terms, they have to be seen as indispensable.  As all over the world we celebrate the one-year anniversary of fifteen days to flatten the curve, we have yet to acquire any data suggesting that the past year of life-destroying lockdowns and politicised behavioural mandates has done anything to keep us safe from the kung-flu. While lockdowns made a comeback in Europe and other regions, it is impossible to ignore the lockdowns' disproportionately deadly effects and the numerous studies demonstrating their futility. However, the media still retain their grip on the narrative that NPIs and other measures remain necessary to prevail in our fight against this virus. Government officials, in lockstep with big tech and nearly all major news outlets, have controlled the NPI narrative to such an extent that its proponents have simply sidestepped the burden of proof naturally arising from the introduction and continued support of novel virus mitigation strategies, happily pointing to the fact that their ideas enjoy unanimous support from the corporate media and government officials across the globe. Unsurprisingly, this seemingly impenetrable narrative rests on the critical assumption that NPIs, or behavioural instructions, have kept us protected against Covid-19. None other country than Sweden was the recipient of more rampant criticism on the response to the novel coronavirus. Since the middle of the summer, or even sooner, everybody started to acknowledge the Sweden response (or lack of one) had not been the disaster foreshadowed by the experts on television. Yet, the critics still claimed that they could have saved many more lives if the Swedish government followed the example of the other European nations, pointing out that its Scandinavean neighbours, Denmark, Finland and Norway, fared much better due to imposing those praised restrictions of people's liberties. Actually, contrary to what you have been led to believe, Sweden was, and still is, no less stringent than its neighbours. Be that as it may, a paper published in August outlines the factors which led to Sweden being in a worse position from the get-go, compared to its neighbours, as well as it defends the lockdowns and other procedures would be totally useless. By the time Sweden would hypothetically close its borders and encarcerate its citizens in their homes at the same time as their neighbours, the kung-flu had already been circulating freely, particularly in Stockholm, for about a fortnight, owing to "Sweden’s 'sport' break (sportlov), where families often go to Italy or Austria for skiing", Nevertheless, the two most important aspects they considered were the weight of the migrant population and the "dry tinder". About the former, it is pretty well established the people with darker skin, living in higher latitudes (outside of the tropics, where they are adapted to live), have a greater likelihood of dying from Covid-19 - this in mainly due to having darker skin that inhibits the production of vitamin D, which is extremely important to fortify the immune system. On the latter, the "dry tinder" aspect alludes to the fact that Sweden had previously had a couple of flu seasons milder than usual, unlike the other Scandinavian countries. Still, Sweden has endured far better than most of the other developed nations. 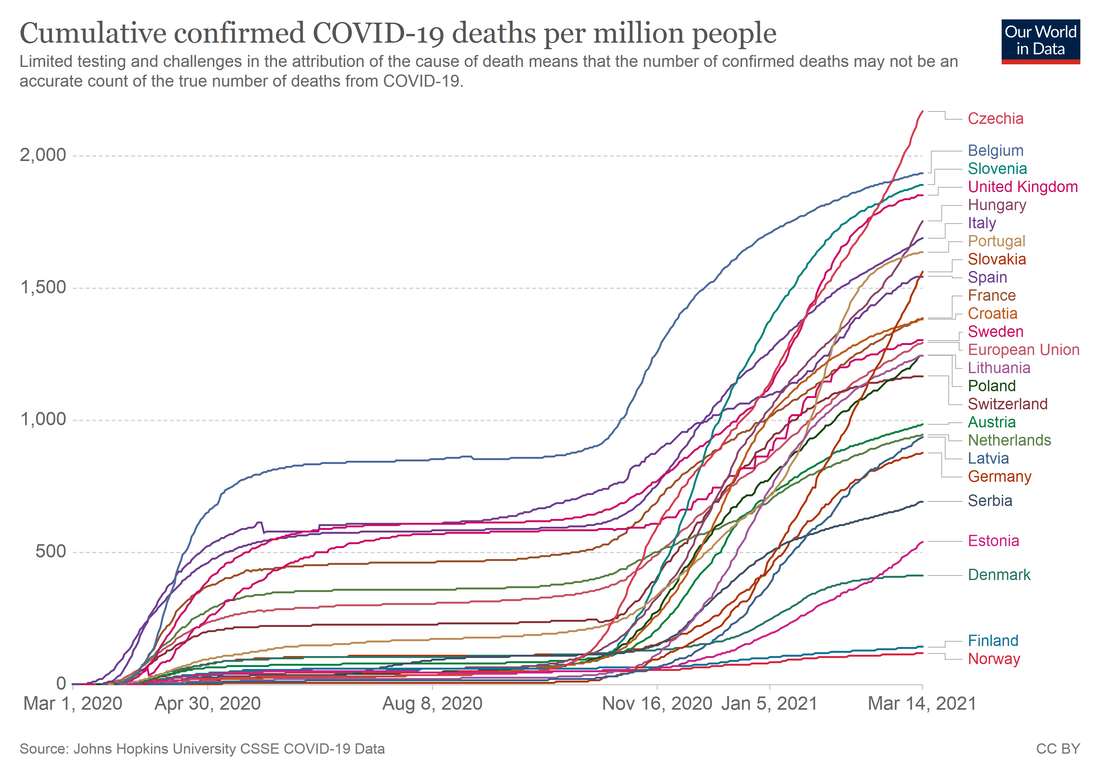 Across the pond, among the few US states that did not impose statewide restrictive measures, Florida has been the most mediatic, maybe because of its size and importance. In light of everything our officials have babbled about how this virus spreads, it defies reality that Florida, a fully open and popular travel destination with one of the oldest populations in the country, currently has lower hospitalisations and deaths per million than California, a state with much heavier restrictions and one of the youngest populations in the country. While it is true that, overall, California does slightly better than Florida in deaths per million, simply accounting for California's much younger population tips the scales in Florida's favour. More specifically, Florida has zero restrictions on bars, breweries, indoor dining, gyms, places of worship, gathering sizes, and almost all schools are offering in-person instruction. On the flip side, California retains heavy restrictions in each of these areas. At the very least, Florida's hospitalisations and deaths per million should be substantially worse than California's. Those who predicted death and destruction as a consequence of Florida's September reopening simply cannot see these results as anything other than utterly remarkable. Even White House Covid-19 advisor Andy Slavitt, much to the establishment’s embarrassment, had no explanation for Florida's success relative to California. Slavitt was reduced to parroting establishment talking points after admitting that Florida's surprisingly great numbers were "just a little beyond [their] explanation". 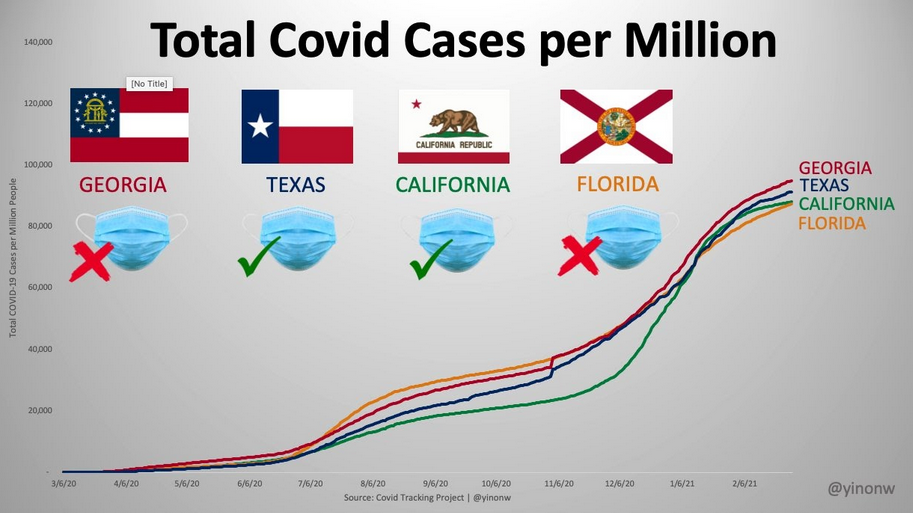 Still, do masks and lockdowns serve their stated purpose? As the graph above shows, they do not, considering only masks at least. All the same, to demonstrate that I am not cherry-picking, and in view of the fact a picture is worth a thousand words, here comes a barrage of charts - on the top left one, California is blue and Florida is grey.
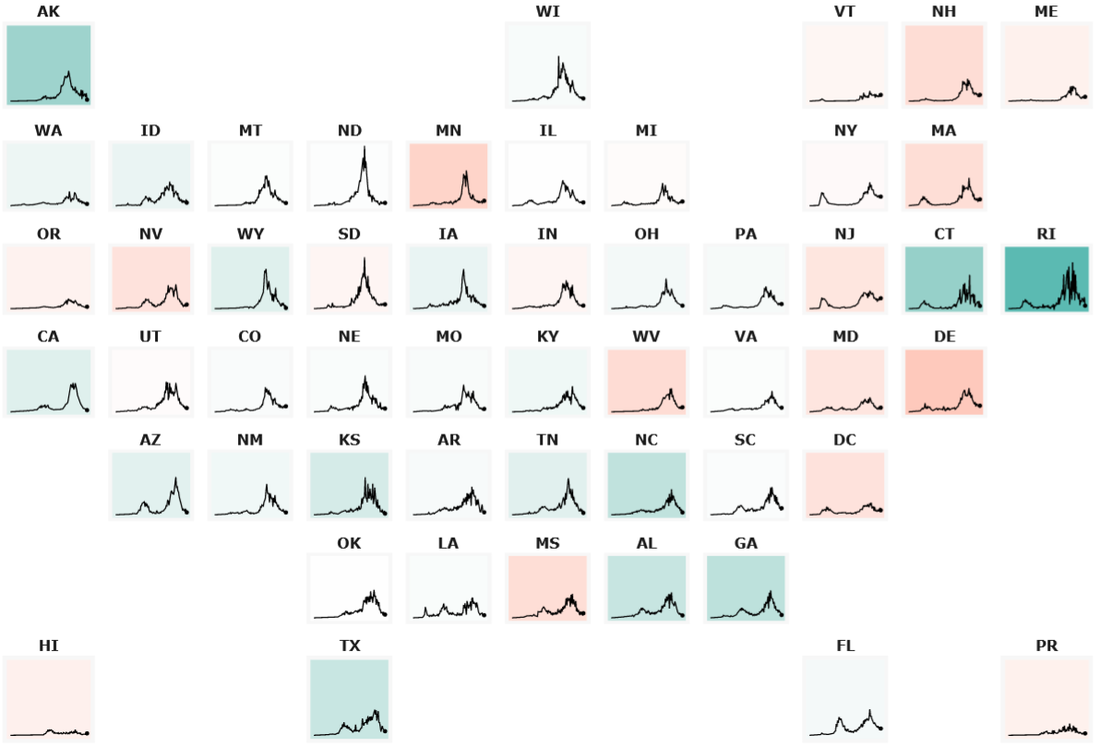 Daily new cases per 100k people; from John Hopkins Coronavirus Resource Center If it is not the NPIs that shape the course of the virus propagation, then what could possibly be? Seeing that similar patterns are formed among bordering and nearby countries and states, instead of legislative decree, case counts and mortality rates are strongly correlated with temperature and latitude, a concept known as "seasonality". Evidently, whereas varying degrees of behavioural mandates have had no noticeable impact on cases, thanks to seasonality, identical regions follow similar case growth patterns. For the firm believer in NPIs, these simultaneous and nearly identical fluctuations between cities within the same state and among states having similar climates are inexplicable. After accepting seasonality as one of the driving factors behind case fluctuations, we can start speaking of "Covid season" as pragmatically as we speak of "flu season" - this is after all the kung-flu. A helpful visual of what covid season might look like, based on the Hope-Simpson seasonality model for influenza, can be found here. As a bonus, Alabama recently came under heavy fire after thousands of maskless football fans took to the streets to celebrate their team winning the national college football title. FanSided, among others, was quick to label the large celebration as a "superspreader" event, and health officials were worried that the Alabama "superspreader" was going to result in a huge case spike. Here is what really happened. 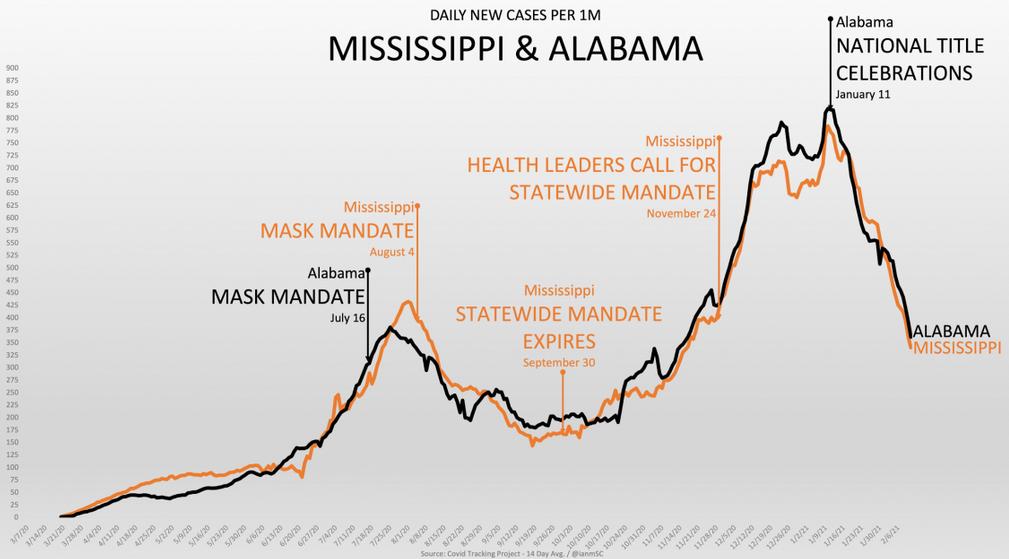 Miraculously, cases immediately plummeted after Alabama’s "superspreader" event and continue to dwindle to this day. If that did not suffice, Mississippi, Alabama's next-door neighbour, followed a nearly indistinguishable case pattern, despite hosting no potential "superspreader" events.
Moving on to the results begotten by those draconian policies, it is of paramount importance to note most of the excess deaths of last year were driven by our governments' measures. As Daniela Lamas, a critical care doctor at Brigham and Women’s Hospital, has written in a Washington Post article, "[t]hough we have always known that the cost of this pandemic would be greater than the number of the dead, we are only beginning to understand its true magnitude. In what might be a final wave of this pandemic, we find ourselves treating patients who have avoided the virus only to succumb to its many unintended consequences — addiction, untreated disease and despair". However, it was not the pandemic that caused this single-minded focus, where Covid-19 is the only harm to be taken into account. Instead, it was the government-imposed policies enacted in response to the pandemic. Without surprise, a pathogen alone with such a narrow demographic impact cannot cause such devastation in so many. In reality, it has been the NPIs that locked people out of their workplaces, schools, hospitals, and churches, wrecking life for billions of people worldwide. "The long shadow of this disease is everywhere," Ms Lamas writes. Although it is a long shadow all right, the shadow belongs to government interventionism mainly, and, partially, the public panic fueled by media hysteria that led people to acquiesce to massive violations of their rights and freedoms. Sadly, the refusal by the media to report objectively and soberly the facts about the kung-flu and - like the link between obesity and the risk of dying from Covid-19 -, especially, the calamity occasioned by overstepping technocrats is keeping the public in the dark to this day, believing these actions to be absolutely necessary to control the spread of the virus and, consequently, to keep deaths at a minimum. In conclusion, that is the problem with all this absurdity. Our rulers act on the grounds the virus can be controlled. Unsurprisingly, and as I exposed on those graphs above, the kung-flu, once it reaches a territory unchecked in the middle of the Covid/flu season, it is impossible to stop its advance, no matter how stringent populations become. To draw a parallel with ancient times, our rulers are stealing from the playbook of the shamans. These measures are nothing more than modern versions of the rituals and sacrifices our ancestors performed to please the gods. In those days, in order to make sure, or try to, the harvest would yield enough food for the population, they would do things like the rain dance or slaughtering thousands of individuals, particularly virgin girls, to make the gods happy and, in turn, allowing the crops to be fruitful. On the one hand, if the harvest turned out to be a bonanza of food, the people would link that outcome to those practices, with the priests and rulers being exolted for their good leadership and superior intellect and powers (for communicating with the gods and knowing what they want). On the other hand, if the harvest became a failure, then the shamans and leaders would simply declare the sacrifices were not enough or that the gods disliked the offerings - perhaps the virgin was a bleeder. In this case, they would double down, triple down, and so on, until a generous harvest season would arrive. Obviously, they had to do this so as to maintain the illusion of having dominion over nature and, therefore, keep the people (happily) under their rule. In the end of the day, that is what this all boils down to: superstition. Whether one carries a shamrock or horseshoe for good luck, or someone else consults a clairvoyant, they both do it to have a sense of control in the chaos that is life. Nevertheless, going back to the present, the public is increasingly being more doubtful about the true danger the kung-flu has posed, in particular the actual death toll caused by the virus and not being a mere coincidence. In other words, they are beginning to question what is the real amount of individuals that died from Covid and not with Covid. Around the globe, ever more swaths of people are realising that lockdowns were pointless, unnecessary, and destructive. Those who hold positions of authority in politics, belong to the media or others who have been spewing fearmongering spatter through our screens for the past twelve months are bound to face a reckoning. Will the modern day shamans lose control of the situation? Are the people finally discerning the technocrats powerlessness and irrelevance? Let us not jinx it, though I am keeping my fingers crossed and kissing my rabbit's foot. To cap it all off, if the technocracy loses its grip in this field, could this sceptical stance expand into other areas, say the monetary, the financial or the economic ones? Sure, if that is God's will.
0 Comments
Having a financial crisis after experiencing a tremendous one just a year ago, is something few people are expecting. Regardless, one would be foolish to completely dismiss a crash right around the first anniversary of the last one. However, in spite of being very little reason to suggest a repeat of the 2020 Global Financial Crisis (GFC2), or anything close to it, is going to occur in the following weeks, some indications point for a new financial system meltdown not being as fanciful as the laws of probability would have you believe. Be that as it may, I still think the most plausible scenario is for some correction in the markets, particularly in the stocks' one, due to rising instability as the (winter) quarter-end bottleneck nears. Following the GFC2 and lifting of restrictions during last spring, every market, from stocks to high-yield bonds, has gradually been returning to pre-corona levels, having been driven by the assumption that the (global) economy was going to totally and immediately recover, like the flick of a switch. With all the monetary and fiscal "stimuli" injected in the economy and financial markets, the much hoped for "V-shaped" recovery was in the bag. Although the real economy not experiencing the putative recovery, the presidential election results, the vaccine discoveries, as well as the Blue Sweep in Congress, propelled markets, in general, to assume the economy is bond to roar, 1920's style. Without surprise, the stock markets have been the main adherents to this narrative. Albeit a worldwide phenomenon, let us just focus on the US financial markets. In view of going through such a monumental rally since early November, according to Deutsche Bank, by late January most of the respondents (89%) were seeing some bubbles in financial markets (left graph). Curiously, the Bank of America Global Fund Manager Survey (FMS) of February (right graph) reports that only 13% of the managers surveyed took the view that the US stock market was in a bubble. Notwithstanding, more than half of them felt the bull market was getting exhausted.
On account of this topic deserving a post (at least) for its own, the discussion about the stock market being at fair value or in a bubble, despite being interesting and important, it is rather irrelevant for today's subject. Surely, there are several of indicators that are, or have recently been, at and near all-time highs, though valuation metrics (left chart) do not tell the whole story. Nevertheless, there has certainly been bubble-like behaviour. Starting with the army of day-trading Robinhooders, receiving their investing tips in highly esteemed financial venues such as Instagram and TikTok, strolling to the relentless amount of IPOs and SPACs that only seems to end when everybody and their mother have one, in addition to the outperformance of stocks with negative earnings, and ending with the short squeeze fueled by r/wallstreetbets crusaders, there are definitely some resemblances to a bubble. As the chart on the right shows, which is Citi's Panic/Euphoria model, investors have never been this euphoric, auguring horribly for the 12-month forward return of the S&P 500.
Moreover, the new round of stimulus checks, as part of another $1.9 trn package, which is set to be enacted very soon, "could unleash a $170 bn wave of fresh retail inflows to the stock market, according to Deutsche Bank AG strategists." Therefore, it is no wonder why the demand for puts has not accompanied the surge in call-buying - as demonstrated in the historical low on CBOE's put-call ratio (left chart) -, because ever since the March trough, short-sellers have been slaughtered, as the the graph on the right depicts.
All the same, the reverence for the technocratic institutions responsible for all the record "stimuli" has prompted those in the financial services industry (as reported by the FMS) to take never-before-seen levels of risk. Hence, their cash balances has not been this low since 2011, which proved to be a bad decision by the middle of that year (Eurodollar #2). So, an eventual liquidity stress is far from the managers' minds. What could possibly go wrong?
Thus, investors are positioning themselves according to either the "roaring 20's" or the "commodities supercycle" narratives, or more likely both of them. Bearing in mind what I asserted on Monday, "[a]s soon as individuals start seeing their bank accounts ballooning through their own endeavours in the economic system, as opposed to handouts from the political system, consumption will pick up, although that is naturally taking a lot of time to ensue. Nevertheless, one thing is for certain, as long as society holds this collectivist mindset that is beholden to politicians and technocrats, an economic boom, worthy of this designation, will never happen and, thus, a commodity supercycle will have to be deferred".
At least one bank is getting worried about the prospects for stocks. According to Bank of America’s Sell Side Indicator, which tracks average recommended stock allocation by Wall Street strategists, by rising to 59.2% it is signaling that bullishness is overextended and is now time to sell. Although that supports the view that equities are overdue for a correction, it does not insinuate that a financial crisis is on the horizon. For that, we have to look at other indicators and markets. Having said this, the T-bills (along with the 2-year; left chart) and the US dollar (right graph) have been implying since the beginning of this year that, as a reflection of the state of the economy, financial conditions have deteriorated. Obviously, this alone does not mean the markets are about to crash. However, it suggests that the financial system (Eurodollar) has been growing more wary of potential deflationary risks, and rightly so.
In case it is not clear in the graph above and you have not been paying attention, yields of the T-bills have curiously been dwindling since early November, being extremely close to the zero lower bound. Lately, the explanation for this has been something to do with the Treasury General Account (TGA). More specifically, the TGA is the account the US Treasury Department has at the Fed. Supposedly, due to the release of fiscal "stimulus" engendered by Uncle Sam on the economy, the TGA balance will decline from $1.6 trn to $500 bn by the end of June. Basically, this roughly $1 trn decline will occur either through waves of fiscal spending, which will expand deposits and reserves at large banks or, if spending is too slow to meet the $500 bn target, through bill paydowns. Furthermore, coupon (notes and bonds) issuance will be $1.4 trn over the first half of the year, which will be bought mostly by banks. However, an obstacle arises. The Supplementary Leverage Ratio (SLR), which, as the name implies, supplements the US leverage ratio by taking into account, besides on-balance sheet, certain off-balance sheet assets and exposures - learn more here; what consists exactly is not important, though -, is going to be fully implemented as the regulatory break (enacted during the GFC2) is set to expire on March 31. Unsurprisingly, this re-imposition is going to once again include US Treasury securities and deposits at the Fed (bank reserves) on the calculation of this rule. Allegedly, owing to the SLR, the commercial banks in the US, mainly the primary dealers, do not have the balance sheet at the bank operating subsidiary level to add $1 trn of deposits, reserves, and Treasuries. Unless we get an extension on the SLR relief, banks will have to turn away wealthy households’ and institutions’ deposits, which will then go to money market funds. Despite that, money market funds will face a constraint too. The marginal asset they will direct inflows into, the Fed's overnight reverse repurchase agreement (ON RRP) facility, is capped. Each money fund can place only $30 bn into this facility, which is just too little. In fact, banks’ balance sheet constraint becomes a collateral constraint for money market funds. Even though collateral supply from coupon issuance will absorb this cash over time, money markets react to what happens now, and with $1 trn of new cash, there may be many pockets of collateral scarcity as these flows play out in real time. So as to resolve this, the Fed has to intervene once more and allow intermediaries to park that extra trillion dollars in cash somewhere. Otherwise, if the Fed refuses to uncap the ON RRP facility, T-bills and repo could go negative. Going back a bit, what banks turning away depositors mean is that, in order to avoid complying with the cost of having "too many" deposits, the banks may impose a negative interest rate on those bigger deposit accounts. In addition, unless the Fed steps in aggressively and either grants banks SLR relief and/or the ON RRP facility is uncapped - so that banks have a place to park the "flood" of $1.1 trn in excess cash instead of turning it away - the US dollar Libor-OIS spreads are expected to reach zero by June, on account of foreign banks being the ones holding the bag, warehousing the rush of reserves. In part, I agree with this reasoning, particularly with the assessment the collateral scarcity will lead to lower yields. Yet, that whole point about banks running out of space for the safest and most liquid instruments (US Treasuries, bank reserves and cash) sounds ludicrous to me. As a matter of fact, since 2014, in spite of SLR being online, primary dealers kept on accumulating USTs and deposits without a problem. In my opinion, the plunge in T-bills' yields has been a result of, besides the diminishing supply being issued, rising concerns around the creditworthiness of individuals, businesses and governments as well, like the next table demonstrates. Being presented here the ratings of sovereigns, which are shown to have slipped, you can imagine what it has been like for companies and financial assets like corporate bonds and ABS. 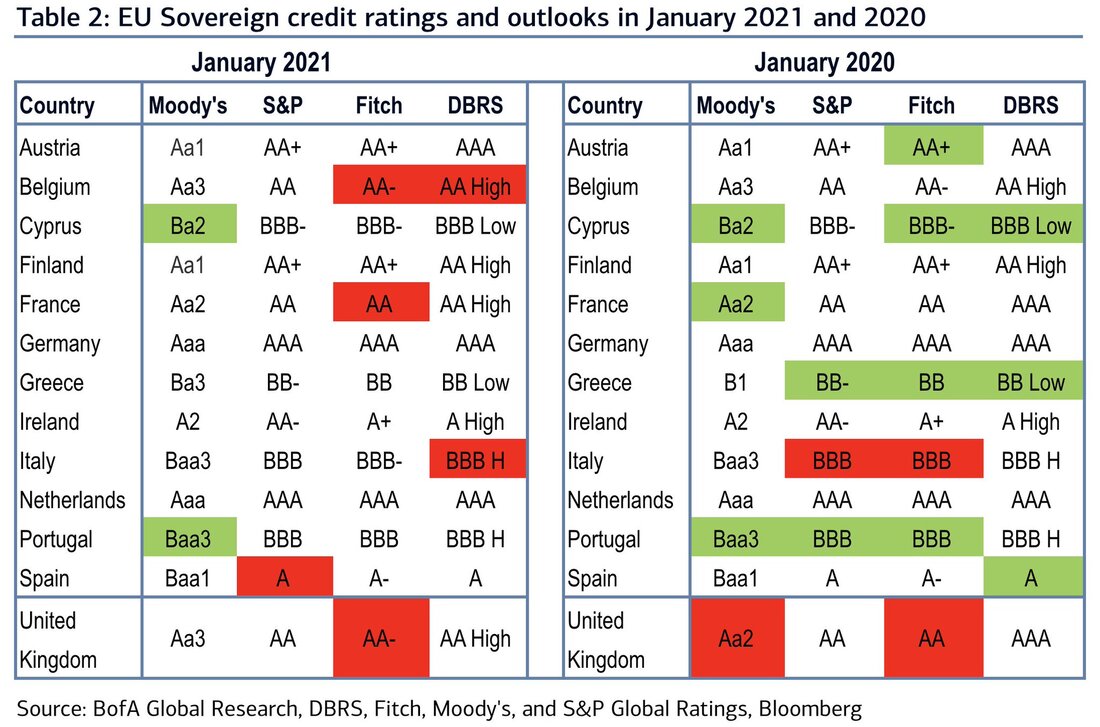 Getting closer to the crux of today's matter, the overnight repo market has shown last week some irregular behaviour. As the chart on the left shows, the overnight repo for the 10-year Treasury traded deeply "special", which means the repo rate is negative, as a result of massive short-selling speculation. In a nutshell, so many investors are short the 10-year UST that there are not enough to go around. Ergo, the rate to borrow the 10-year in the repo market reached a low of -4% on Wednesday, March 3, and printed around -4.25% the following day (left chart). An investor lending out cash for the 10-year notes would end up having to pay, rather than getting paid. Oddly, that is below the -3% charge leveled on users who fail to deliver a security to a counterparty. Besides the colossal short base, the Fed has been taking supply out of the market through its large scale asset purchase programme, QE6. Evidently, this was the lowest print since the absolute record of -5.75% touched during the GFC2. Feeling the urge to act, "the Fed loaned $8.7 bn of its $10.9 bn holdings of US 10-year notes on Thursday, easing the debt squeeze", according to Scott Skyrm, executive vice president at broker-dealer Curvature Securities. By Friday, believe it or not, demand in the ON RRP facility peaked at $11.2 bn, apparently exceeding the Fed's holdings - seems too small an amount, though; perhaps $10.9 bn is what is alloted for this facility.
Moreover, because of the illiquidity/volatility that has impaired the smooth functioning of the financial system, it has not been just the Treasury market to feel the repercutions (right chart). What caused the small uptick in illiquidity was likely a mix of portfolio repositioning (reflation trade) and the "operational error" in FedWire, late last month, which triggered the latest correction in the stock market (left graph). Finally, in order to correct these key issues dealing with market functioning, a lot of people were awaiting for Powell or some at Fed to at least give the markets a hint that they were thinking about reviving Operation Twist, with the new one being the third instalment. In case you do not know, this programme consists of a simultaneous selling of front-end Treasuries (bills and shorter-term notes) and buying of longer-dated paper (bonds and longer-maturity notes). According to the advocates of such a policy, a Twist 3.0 will: i) pull up front-end rates; ii) stabilise back-end rates; and iii) it does so in a reserve neutral way that lessens bank SLR pressure to hold more capital. Hence, part of their solution entails taking from the market even more highly sought assets, even if they are wanted just to be shorted later on. Like I wrote a few paragraphs above, the SLR is no impediment for banks to hold more Treasury bonds and notes. Also, removing even more 10-year notes could precipitate more illiquidity due to shrinking supply of an instrument that is having tremendous demand. Notwithstanding, selling T-bills would surely help to satiate the impressive appetite for these assets, improving the health of the financial system.
Bringing it all together, as the squaring of the books take place in mid-March, and taking into account that illiquidity has been increasing, which has been indicated by t-bills and the US dollar (like was shown above) along with the peculiarities around longer-tenor Treasuries, it is reasonable to be concerned. Because of the ensuing collateral bottleneck that is to be expected, the safest and most liquid instrument, US Treasury securities, are going to be faced with a rush of demand. In view of the longer-dated Treasuries having an extremely big short base, a short squeeze will likely follow, not just pushing yields much lower, but provoking a huge liquidation in other asset classes, especially equities, to pay for the margin and collateral calls and to cover the short positions to boot.
In relation to what was discussed before about the SLR and its implications for short-term rates/yields, there is a real and rather big chance that these will go negative (because of collateral shortage) and, more importantly, stay negative (on account of unrelenting demand for the most liquid instruments). Undoubtedly, such a background emerging is set to feed more vulnerability in the (global) financial system. To conclude, do not let yourself be surprised by a new crash in the following days. Seeing that there are all of these factors causing instability as we approach the notorious March bottleneck, the potential for some serious turmoil is certainly here. However, as I stated in the beginning, a correction rather than a financial crisis is what seems to be more likely to happen in the next few days. Considering that markets participants will gradually awake up to reality and realise the economy is not recovering, with households and businesses going through terrible financial distress, whether the next financial crisis crops up this month or not is immaterial. What is important to understand is that, in all likelihood, one is bound to befall on the world in the near future. For almost four months, since the honourable and ultra-charismatic orator Joe Biden rallied a record number of voters (that even raised the dead), to get fascism and white supremacy out of the White House, and the discoveries of vaccines for the kung-flu, sentiment on the part of pretty much everybody has improved. On the one hand, the vaccines "injected" a sense that life would return to normal, the "old" normal, and not stuck in this twisted and abhorrent "normal" we have been told to be necessary (to flatten the curve, not to kill granny, or something like this). On the other hand, as the medical community was on a crusade to find the vaccine, the stimulus and financial aid which were going to be put together by governments, especially the ones engendered by the Biden administration and the soon-to-be Democrate-controlled Congress, were aimed at supporting the economy so that the house of cards would not collapse in the meantime. As a result, and because of the public's reverence for technocrats to boot, (most) markets began to price in an economic recovery, or at least the initial steps of one, as businesses started to perceive a better economic outlook than previously surmised, albeit households do not appear to share the same view. To wit, some of the markets that have been hinting at recovery more strikingly are the commodities. Although that is what some analysts take from them, are commodities really suggesting an inflationary boom? Are the "Roaring 20's" staging a comeback? Among the financial institutions which take this view there are JP Morgan, Bank of America and Goldman Sachs. In their opinion, the commodities secular rally will be a story of post-corona-phobia economic recovery, as well as "ultra-loose monetary and fiscal policies". In addition, commodities may also jump as an unintended consequence of the fight against climate change, which threatens to constrain oil supplies while boosting demand for metals needed to build renewable energy infrastructure and manufacture batteries and electric vehicles, namely cobalt and lithium for example. Furthermore, commodities are typically viewed as a hedge against inflation, which has become more of a concern among investors. In the end, as if we are in some post-war period in which there is a large-scale effort to rebuild what was destroyed, owing to tremendous demand, prices of raw materials are going to skyrocket for the next quarter of a century, following the depiction below. 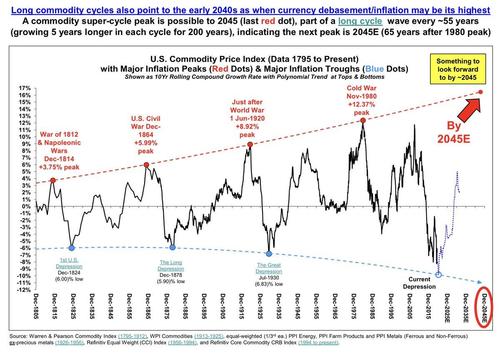 For now, commodities' prices have indeed surged since the lows of the March Meltdown, having even reached multi-year highs, as the next couple of charts show. In spite of the rally in the Bloomberg Commodity Index (top graph) seeming to be somewhat extraordinary, its performance pails in comparison to the one in the Index of Spot Raw Industrials (bottom chart). By taking a look at this, it makes you wonder if the inflation spigot has been tapped at last. 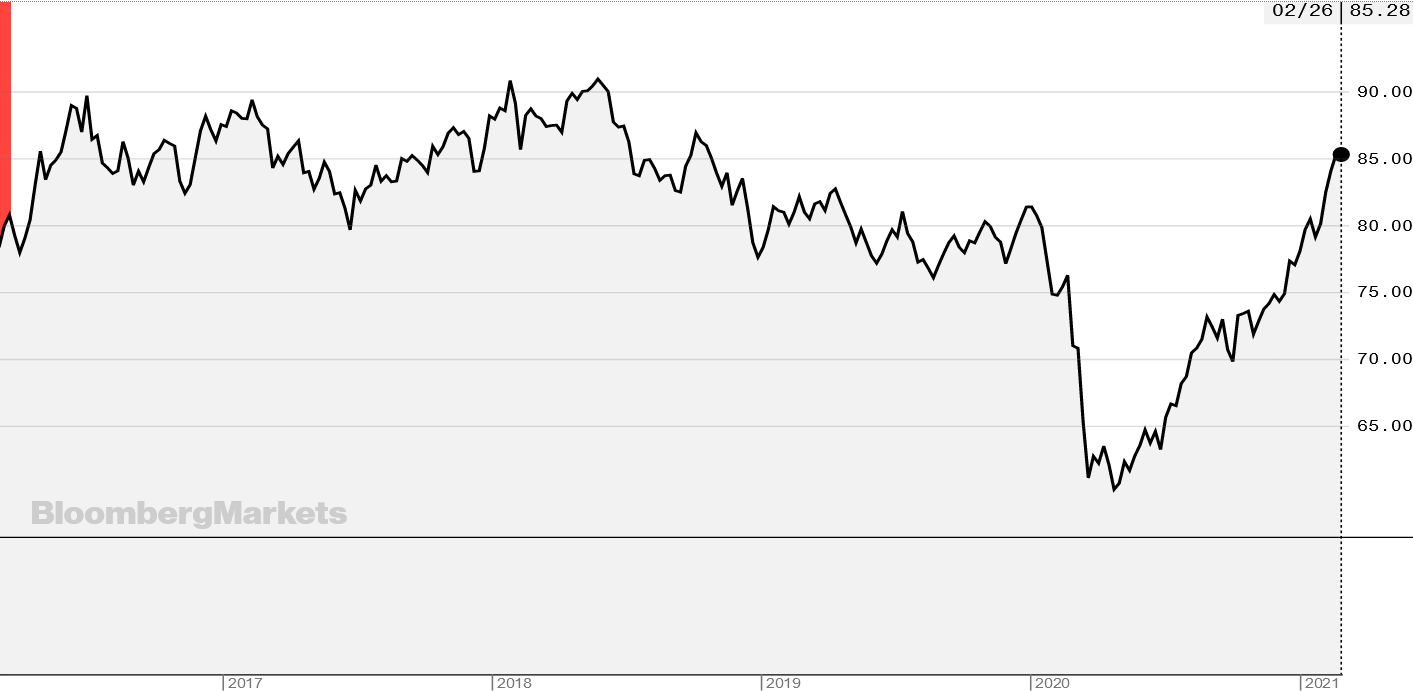 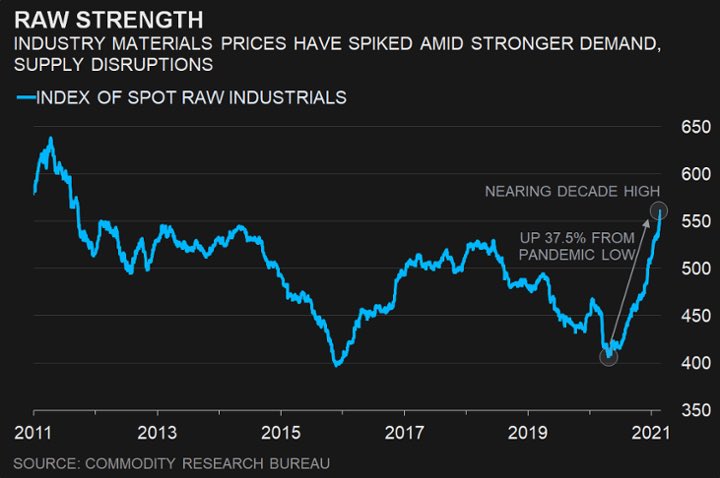 Notwithstanding, on Friday, February 28, "[t]he return on commodities as measured by the 23-member Bloomberg Commodity Index dropped the most since April as a strengthening dollar reduced the appeal for raw materials priced in the currency. Meanwhile, a surge earlier this week in US government bond yields has fed into increasing concerns that accelerating inflation could lead to easing monetary policy support", Bloomberg reported. To begin with, as I have explained in the Eurodollar system series (see part I, II, III and bonus), rising UST's yields are indicative of improving financial and economic conditions (i.e. money creation is easy), which always happens after an economic contraction or just deceleration reaches its trough. Similarly, the US dollar falls in relation to its peers, particularly those in the EM domain, when growth prospects are favourable. Thus, affirming the accelerating inflation has arisen on account of the "accommodative monetary approach [(translation: low yields)] that helped fuel the recent price gains", having just in the previous sentence alluded to the recent uptick in the dollar, it tells you something is amiss. By turning our attention to the next graph on the left, the yield of the 10-year Treasury (orange line), even though it has climbed quickly, meaning market participants are foreshadowing an improvement in the monetary landscape in the long-run, the copper-to-gold ratio implies much more pronounced growing expectations, albeit still short of pricing in the much-awaited recovery. On the flip side, seeing that the dollar, has not only stopped dwindling, but has, since this year broke out, gone up a bit, financial conditions have, according to the greenback, been getting uptight lately.
Hence, despite troubles in the present, a burgeoning economy awaits us in the (distant) future. As the saying goes, patience is a virtue. However, as they have demonstrated many times throughout the times, investors seem to lack several virtues, patience being one of them. Since the beginning of the year, investors have piled in the commodities realm (left chart), greatly contributing for the commodities' outperformance in relation to the stock market (right chart). Curiously, this current "mania" has, on the face of it, bucked the decade-long trend in energy fund allocations (bottom graph). If the supercycle in commodities is actually in the cards, then stocks like the energy sector are the bargain of a lifetime. 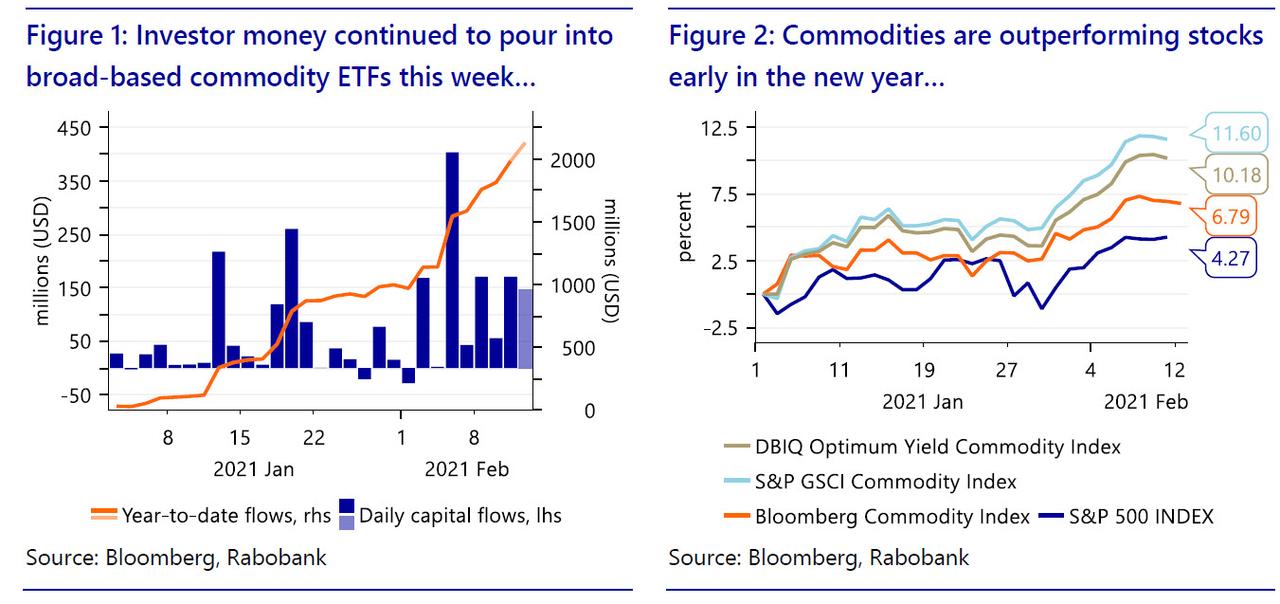 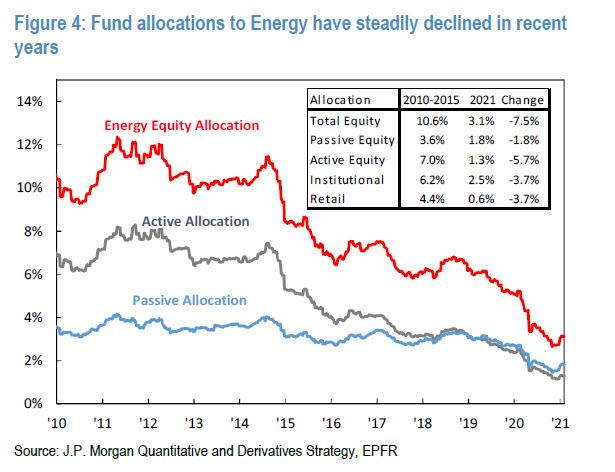 Moving on to the real economy, the soaring prices for raw materials have been taking their toll in the economy, probably causing more harm in the near-future. "Timber growers across the US South, where much of the nation's logs are harvested, have gained nothing from the run-up in prices for finished lumber. It is the region's sawmills (...) that are harvesting the profits", writes the Wall Street Journal. In fact, the glut of timber is so great "that mills are paying the lowest prices in decades for logs." Evidently, the corona-phobia, and the measures imposed because of it, has led sawmills to run "close to capacity", rendering them "unable to keep up with lumber demand." Moreover, according to Bloomberg, the corona-phobia "upended food supply chains, paralyzing shipping, sickening workers that keep the world fed and ultimately raising consumer grocery costs around the globe last year", leading to farmers, which for instance raise cattle, hogs and poultry, "getting squeezed by the highest corn and soybean prices in seven years (...) [lifting] the costs of feeding their herds by 30% or more." In the coming months, "higher price tags for beef, pork and chicken around the world" will be the consequence of producers seeing their profit margins being squeezed. The CPI is not going to reach YoY 4%, as commodities are suggesting on the next chart, in view of consumers lacking the purchasing power to sustain such an increase in prices. Because of mass unemployment, few jobs openings and poor wage growth, consumer demand is going to take some time to return to 2019 levels, which, by the way, was a terrifying year on account of being on the verge of recession. Therefore, retailers are only going to pass the higher costs to consumers when they can no longer squeeze their margins any further. 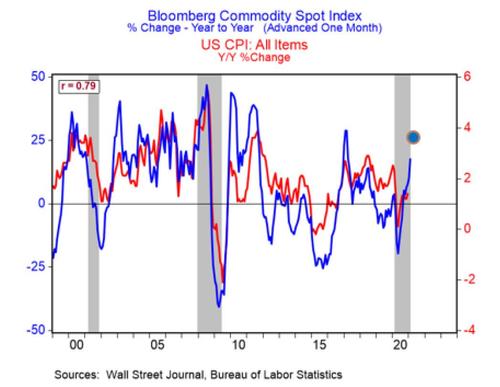 By the same token, the transportation segment of the supply chains have also been obstructed, mainly the shipping industry. The Shanghai Containerized Freight Index (SCFI), which represents weekly spot container freight rates (export) from the port of Shanghai, has a current reading which more than triple its levels in May of last year. Likewise, other freight indices tell a similar story. In a nutshell, the reasons are quite simple. For one, supply growth has shrunk considerably in recent years, with three major shipping alliances having become far more disciplined around capacity. Furthermore, recent supply chains disruptions from a lack of containers (boxes in the wrong place), the kung-flu (lack of staff), geopolitical tensions (China-Australia spat) and weather (US East Coast cold snap; and in Europe to some extent as well) have not helped matters either. Then, on the demand side, consumers have been propped up by government handouts and, more importantly, the vaccines coming online has, like I said above, led many to believe the pre-corona normality is returning in a jiffy. Therefore, due to being aware of these disturbances in the supply chains, companies have been preparing in advance, prompting them to acquire the supplies they need before these get jammed in traffic. Accordingly, the IHS Markit Manufacturing PMI figure, which came from 59.2 in January to the current 58.6, was wrongly buoyed by a substantial lengthening of supplier delivery times amid significant supply chain disruption. Ordinarily a signal of improving operating conditions, longer lead times for inputs reportedly stemmed from supplier shortages and transportation delays due to government-imposed restrictions. The extent to which wait times lengthened was the greatest since data collection began in May 2007. While orders remain nottably lagging, prices of inputs exploded to their highest since 2008 - when oil was trading at $140. As Chris Williamson, chief business economist at IHS Markit, stated, "shortages of raw materials have become a growing problem, with record supply chain delays reported in February, contributing to the steepest rise in material costs seen over the past decade", leading to prices "charged for a wide variety of goods coming out of factories [being] consequently rising, which will likely feed through to higher consumer inflation."
So, we now know why commodities have spiraled lately. Regardless, there is very little backing this trend. For being chiefly caused by government-imposed hindrances because of the corona-phobia, these higher costs will come down as restrictions are lifted. Longer-term trends point to a cooling down for some materials. For starters, the energy transition that heralds a bright new age for green metals such as copper would be built on the decline of oil. Even producers of iron ore, the biggest market of mined commodities, expect prices to weaken over time as Chinese demand starts to decline and new supply comes online. On the coal front, there is an even bleaker outlook with producers looking to exit the market altogether, as the world switches away from the heavy-polluting fuel. Being the major beneficiaries of China's industrial expansion that resulted in the last commodities supercycle, iron ore, coal and oil prospects augur horribly to this conjectured one. On the oil front, prices have recovered as demand rebounded more strongly than many had expected, after reaching the never-imagined $-42 per barrel. Early in 2021, the Organization of the Petroleum Exporting Countries (OPEC) and its allies were holding back crude equivalent to about 10% of current global supply. Long before that, market fundamentals have shifted, especially in the US with the emergence of shale oil. Ergo, haunting traditional producers is the prospect that a prolonged period of high prices would trigger a new flood of supply beyond OPEC’s control, pulling down prices. Despite copper being on a tear in early 2021 thanks to rapidly tightening physical markets as governments plow cash into electric-vehicle infrastructure and renewables, insofar as the iron ore, coal and oil markets dwarf copper in scale, the crank up of its usage along with other methals like lithium and cadmium are going to have an extremely limited impact on the broad commodity basket. To cap it all off, while agricultural commodities have their own particular dynamics, soybeans and corn have rallied to multiyear highs, driven by relentless buying from China as it rebuilds its hog herd following a devastating pig disease (African swine flu). Owing to being more dependent on global economic and population growth, rather than the decarbonization trend underpinning excitement in metal, agricultural commodities have very weak fundamentals to justify prices these high as the world moves forward from the kung-flu. Finally, it is not stimmy checks sent by Uncle Sam, or any other government for that matter, that are going to enkindle the much-anticipated inflationary conflagration. Because individuals sense, and rightly so, the government aid is temporary and inconstant, they are not spending money in proportion to what they are gaining in income, as the next graph shows. As soon as individuals start seeing their bank accounts balloning through their own endeavours in the economic system, as opposed to handouts from the political system, consumption will pick up, although that is naturally taking a lot of time to ensue. Nevertheless, one thing is for certain, as long as society holds this collectivist mindset that is beholden to politicians and technocrats, an economic boom, worthy of this designation, will never happen and, thus, a commodity supercycle will have to be deferred. 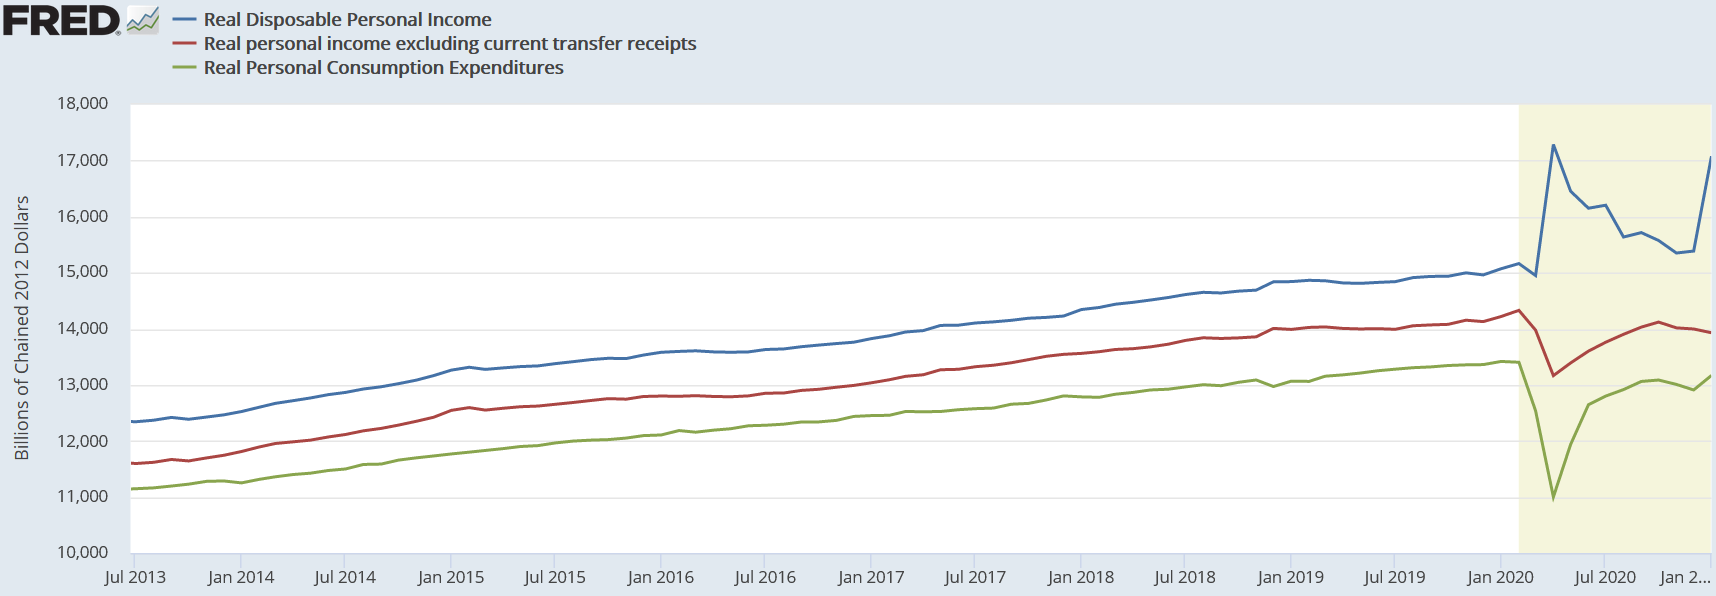 Hence, the question remains: what is super about this? As it is usually the case, investors' and analysts' short-sightedness, of course.
Following our theme introduced a couple of posts ago, I am going to demonstrate how mainstream economists, the supporters of Keynesianism, are providing the logical basis for more action and intervention on the part of the government, getting, in the process, closer and closer to the advocates of MMT (or, as I am calling them now, Knappers). Just how similar to each other are they? That is what we are going to find out. To begin with, the keynesian prescription for a recessionary trough is, in theory, to simply fill it in. To accomplish this, government spending - funded by borrowing rather than taxation - is jacked up so as to limit the economy's downside. In addition, the wizards at the central banks do their magic by, supposedly, keeping interest rates under control, or at least preventing them from spiraling. Notwithstanding, failing to spur the economy back to its previous vivacity, in a quick enough fashion, time becomes a serious problem. Basically, long-run economic damage crops up when hindrances emerge, taking the economic rebound too much time, or too much depth around the trough, which may harmfully reshape economic potential. By the same token, Larry Summers, the former Secretary of the Treasury for President Clinton, during a discussion sponsored by the Brookings Institution on December 1 - I know it is from a while ago, but I was saving it for a post worthy of such a gem -, affirmed that although "there are all kinds of mistakes that are made going into crises (...) among the most important things to do is to make sure we do not have a sustained period of slow growth". Nicely put! According to the paper presented by Jason Furman, former Chair of the Council of Economic Advisers for President Obama, that preceded the debate (if we can call it that), which was elaborated by him and Larry Summers, during contractions, fiscal expansions apparently lead to reductions in the debt-to-GDP ratio. Interestingly, it allegedly "works the same way in any country with high debt", which is corroborated by some fancy econometric models from the IMF or the OECD. Be that as it may, you know this is not true. Hence, the empirical evidence backing the usefulness and the necessity of increased government spending exists and it seems to be almost consensual. This sounds like terrific news for all of us, in terms of recovery prospects. Resuming the presentation of his paper, Furman stated that "demand (…) is something that we are concerned about even in normal times. The interest rate that might be required to absorb all of the savings might be an unattainable negative number. We need to gear the economy towards greater demand to prevent that slow growth in normal times [and] the risks associated with low interest rates". Typical keynesian reasoning: the government has to make up for the slack from the private sector. Nevertheless, he granted that low interest rates pose some challenges, which, since it is not crutial to this discussion, I am not going to dwell on. Despite that, once again, I am making Larry Summers words my own when he claimed that "there are good reasons, not certain reasons, for believing that an economy with a positive neutral real interest rate is going to be a healthier, safer, more productive and more financially stable economy than na economy with negative normal real interest rate". However, I will be departing from Summers from now on seeing that he posits, among other things, that "maintaining a posture of fiscal policy that permits a positive real interest rate is (…) in general the healthier strategy" - the "posture" he is referring to is an expansionary on, aiming at generating inflation. Continuing with that paper, the actions and policies that ought to be taken in order to boost aggregate demand are presented, setting the stage for the putative debate that followed between the authors of the paper, Jason Furman and Larry Summers, Ben Bernanke, former Chairman of the Federal Reserve, as well as Kenneth Rogoff and Olivier Blanchard, who are both former chief-economists of the IMF. A real who's who of Keynesianism. Before we get to that, however, I have to point out one last thing Furman said in his presentation. Talking about the automatic stabilisers, which consist of essentially unemployment insurance and other government handouts, he spouted "[this] is especially important in the United States, where the automatic stabilisers are relatively weak, largely because of the relatively small size of our government as compared to other ones". This is just a downright falsehood. By comparing the government expenditures' weight in GDP, you clearly recognise the US is in line with the major (and most productive) economies – in fact, you cannot make out any correlation between any government's weight on GDP and the respective country's level of development. All the same, this ridiculous remark sets the tone perfectly for the tête-à-tête that followed it. Since the purpose of this post is not to make an exhaustive analysis of the topics conversed about, I am going to highlight only the essential to get us going, although I strongly urge everybody to listen to this economics prattle. Firstly, in the middle of this colloquium, Ken Rogoff ushered in an interesting issue asserting they "do not understand why interest rates are so low [and why it] is a global phenomenon", he continued commenting that "[this] is not just about what the US debt is, (...) [there] is much more going on". To finish his intervention, he claimed to suspect, as Blanchard had before him, the boom in Asia was the greatest contributing factor for Ben Bernanke's "global savings glut". Adding to this hypothesis, Bernanke asserted to be "three key elements. The first is that demographics and rapid growth of the middle-class globally has greatly increased desired saving. Secondly, (...) to an historically unusual degree, the productive investments in the world are in the public sector, in our public goods, as opposed to private sector, which means that to finance them, you need to have fiscal borrowing capacity". Because the third point is sort of irrelevant for today, let me try to decipher what Helicopter Ben meant in his second point. Maybe Summers gave us the answer afterwards, postulating the (real) interest rate to be "a kind of measure of the risk-adjusted productivity of capital", which for being low "is telling you that [the] private investment that [the government crowds] out is not a very costly kind of investment to crowd out". In other words, investment in risky or simply riskier instruments and ventures is subdued, while the safest and most liquid securities are in super high demand. Therefore, how about you investigate why that is the case, instead of immediately opting to request the government to come to the rescue. Regardless, the best was really Furman: "In some sense, we do not need to know exactly what caused [low interest rates]. Was it a global savings glut, was it inequality, was it demography, etc? The important threshold question is how likely is it to continue?". The utter stupidity of these people never ceases to surprise me. How can you know the likelihood of this to persist, if you do not bother to look for the cause? Thank God these imbeciles are not engineers or medical doctors. Just call Uncle Sam and Oma Merkel and they will solve it. Moreover, Furman concluded by defending that "[because] it was gradual across a range of places, (...) your best guess is it will continue. Then, we can debate why it is and again that is a best guess". Let me take a guess then. How about the government? Maybe this is the reason they are so reluctant to examine thoroughly. Bearing in mind Bernanke's first point (about the global savings glut), supposing, for the sake of argument, savings have been building up over the last decade (perhaps, for much longer than that), entailing that consumers are putting aside more of their income on the sidelines. For some reason, these economists believe that there is an almost fetish-like yearning for low-yielding government. So much so, people apparently do not mind earning at most a couple of pennies on the dollar or, in the case of Europe and Japan, pay these nations' governments for the privilege of being one of their lenders. Secondly, to tackle what Larry Summers called "secular stagnation", according to Blanchard, we have "to increase demand, private demand, and the most natural way of doing it is fiscal deficit. (...) It seems to me social insurance and (...) if we provided health care [in] the US, if we basically had tuition-free college education [and] all kinds of things like this, this would make a fairly major difference to a private savings rate". So, budget deficits and something about private savings - is anyone else getting this sense of déjà vu? Having said this, he wants the government to take care of these nuisances, regarded (by most, hopefully) as individual responsabilities, by extending even more support in these areas or outright collectivising these services. In addition, infrastructure projects are to be under consideration, which was mentioned in the paper and proposed by Rogoff to boot. How about an anti-extra-terrestrial defense mechanism, as Paul Krugman once proposed. As Summers went on to affirm, "we have the paradigm shift to the view that having a fiscal policy that absorbs all the savings and maintains demand, (...) therefore we get to full-employment". To sum up, get the government to do anything they can, even if that means changing the constitution, to make people focus all their attention and resources solely on consumption - they are, after all, consumers. Thirdly, due to presumably being fact-driven, if these keynesians take these positions is because the data compels them to take them. According to Rogoff, "there is a lot of evidence now that higher debts [are] associated with lower growth , but (...) emphasis is that, [otherwise], maybe interest rates [would be] even lower and, so, who cares?". Who says interest rates could be even lower? Oh right, the econometric models. Furthermore, to Summers, Japan has been a success, so the story goes. "In fact, Japan has got lower unemployment, has done very well in terms of per capita output, relative to the rest of the world, and the reasons have to do with (...) expansionary fiscal policy". In spite of Bernanke conceding fiscal policy to be the "go-to [automatic] stabiliser", he doe not seem to concur with Summers on account of believing that with effective fiscal expansion, "interest rate will go up, inflation will go up", which has definitely not occurred in Japan for the last three decades. Of course, Rogoff would simply reply that, otherwise, if nothing had been done, interest rates and inflation would have been even more subdued. Finally, we are reaching the focal interest of today's subject. In the opinion of the former Fed Chairman, "monetary policy has actually been, in the United States at least, pretty effective in the last couple of years". To Bernanke, the Fed pivot in late 2018/early 2019, which meant cuts on the target of the federal funds rate, led the economy to full-employment. Albeit, he claims, an effective fiscal policy would render "monetary policy again more effective", because rates would rise and give more room for the central bankers to, supposedly, tackle an economic contraction. Ergo, the explanation for the declared success of monetary policy is that "it is run by a non-partisan, independent [and] professional organisation, which can respond quickly and sensitively". On the flip side, "fiscal policy is for political reasons (...) slow". You still cannot discern what he is hinting at? Fret no more, another member of the panel spelled it out for us. Moving on to Rogoff's view, for being unable to "get around the fact that it is political, (...) the question is (...) how much can you make it technocratic? (...) we read Larry and Jason's paper, it is very calm and logical and if they could be in charge, maybe things would run that way, but we have this very political system". There you go, admission at last. Two sides of the same coin, that is what the keynesians and knappers really are. Despite having some differences, these are not of the ideological kind, but mere technical ones. While the MMT-ers want the central bank and the Ministry of Finance/ Treasury to be one entity (at least in de facto terms) for the government to finance itself, for some reason, the keynesians defend their separation , arguing for central bank independence (for whatever reason). Moreover, the former thinks that knows what money is, while the latter cannot find it. To cap it all off, both factions' rationales may be put like this, quoting them once again, though this time is what they truly reckon, were they to have no filter: "since people in the real world refuse to act like they do in our models, we are just going to force them to act the way we want them to". Unfortunately, the public indulges them by regarding them as experts, whereas a common mortal is just a layman who knows nothing about econometrics. In conclusion, MMT is only a natural progression from Keynesianism. Or is it a regression, seeing that Knapp's State Theory of Money came out far before, four decades to be exact, Keynes' General Theory. Either way, considering that these two schools of thought have many followers, particularly the keynesian ones (the neo-Keynesian, the New Keynesian, the post-Keynesian, etc), across the globe, that dominate economics departments on the most prestigious universities, have the attention of lawmakers and the media, packing the most influential think-tanks like the Brookings Institution, is all you need know to admit that the Blob will carry on growing incessantly, unlike the economy, prompting ever more suffering and resentment as a result. God willing, and to end on a positive note, it is never too late to reverse course and embrace the ideals of liberalism and laissez-faire capitalism, which includes giving the technocrats the boot. 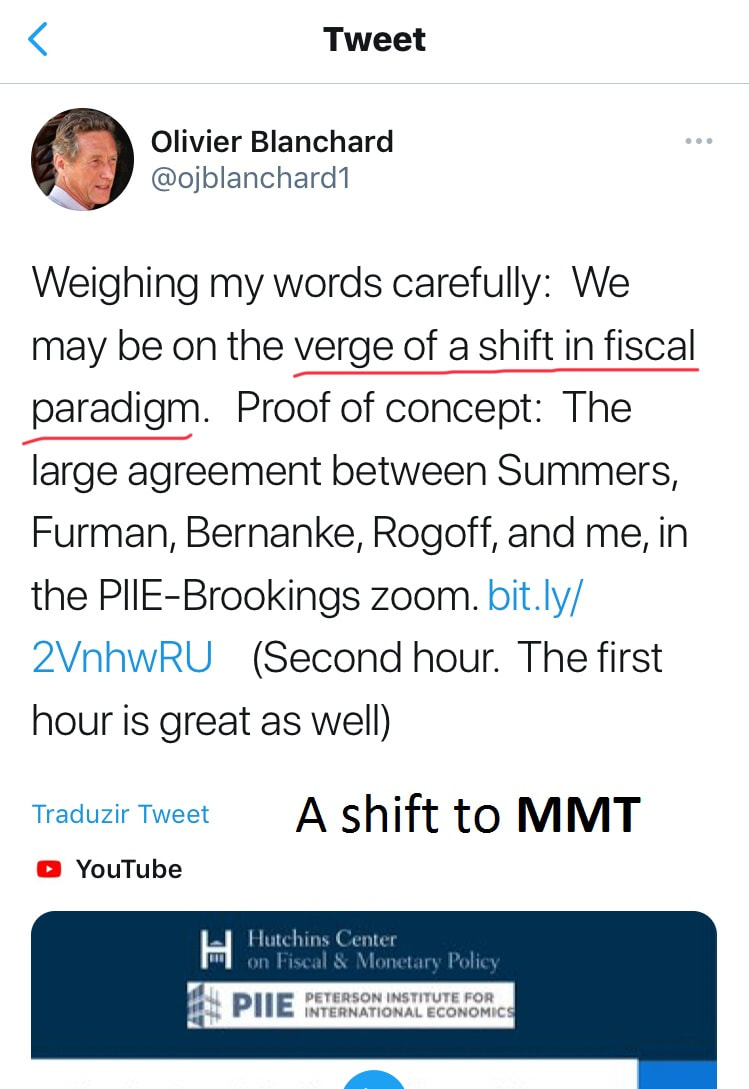 Finally, we are reaching the focal interest of today's subject. In the opinion of the former Fed Chairman, "monetary policy has actually been, in the United States at least, pretty effective in the last couple of years". To Bernanke, the Fed pivot in late 2018/early 2019, which meant cuts on the target of the federal funds rate, led the economy to full-employment. Albeit, he claims, an effective fiscal policy would render "monetary policy again more effective", because rates would rise and give more room for the central bankers to, supposedly, tackle an economic contraction. Ergo, the explanation for the declared success of monetary policy is that "it is run by a non-partisan, independent [and] professional organisation, which can respond quickly and sensitively". On the flip side, "fiscal policy is for political reasons (...) slow". You still cannot discern what he is hinting at? Fret no more, another member of the panel spelled it out for us.
Moving on to Rogoff's view, for being unable to "get around the fact that it is political, (...) the question is (...) how much can you make it technocratic? (...) we read Larry and Jason's paper, it is very calm and logical and if they could be in charge, maybe things would run that way, but we have this very political system". There you go, admission at last. Two sides of the same coin, that is what the keynesians and knappers really are. Despite having some differences, these are not of the ideological kind, but mere technical ones. While the MMT-ers want the central bank and the Ministry of Finance/ Treasury to be one entity (at least in de facto terms) for the government to finance itself, for some reason, the keynesians defend their separation , arguing for central bank independence (for whatever reason). Moreover, the former thinks that knows what money is, while the latter cannot find it. To cap it all off, both factions' rationales may be put like this, quoting them once again, though this time is what they truly reckon, were they to have no filter: "since people in the real world refuse to act like they do in our models, we are just going to force them to act the way we want them to". Unfortunately, the public indulges them by regarding them as experts, whereas a common mortal is just a layman who knows nothing about econometrics. In conclusion, MMT is only a natural progression from Keynesianism. Or is it a regression, seeing that Knapp's State Theory of Money came out far before, four decades to be exact, Keynes' General Theory. Either way, considering that these two schools of thought have many followers, particularly the keynesian ones (the neo-Keynesian, the New Keynesian, the post-Keynesian, etc), across the globe, that dominate economics departments on the most prestigious universities, have the attention of lawmakers and the media, packing the most influential think-tanks like the Brookings Institution, is all you need know to admit that the Blob will carry on growing incessantly, unlike the economy, prompting ever more suffering and resentment as a result. God willing, and to end on a positive note, it is never too late to reverse course and embrace the ideals of liberalism and laissez-faire capitalism, which includes giving the technocrats the boot. During periods of social turmoil and widespread dissatisfaction with the state of (economic) affairs, while true explanations, not to mention solutions, are hard to find, all kinds of theories and panaceas come to light. In this day and age, the revolutionary breakthrough that is set to cure our economic malaise is the Modern Monethary Theory (MMT). What is it? In a nutshell, it is the idea that governments can use deficit spending to help their economies to reach full-employment and to promote savings with very little downside. Furthermore, if the economy gets "over-heated", meaning that "inflation" becomes too high, government simply raises taxes so as to curtail demand. Unsurprisingly, politicians and technocrats love this "new" school of thought seeing that it provides our overlords the grounds to use the powers at their disposable, or to acquire even more, under the veil of boosting economic activity and, more importantly, the general welfare. Be that as it may, the expansion of the government scope is no recent phenomenon - in March of last year, before I began paying attention to Jeff Snider's work, I wrote about this, though I must warn you that the conclusion comes from the erroneous premiss that central banks create money; so you should stick to just the first seven paragraphs. In fact, the Leviathan has been growing, in the West, since the early twentieth century, or even sooner than that. Like I said on the previous post, the government enlargement reminds me of the film The Blob, where this jelly-like, extra-terrestrial being reaches our planet and immediately starts to consume the people nearby, ballooning a bit more from each person it gollops. Hopefully, you will see this is a great metaphor about the destructive entity we know as government. As Milton Friedman affirmed, "if a private venture fails, it is closed down. If a government venture fails, it is expanded." This little aphorysm sums it up perfectly. At the onset, some politician spots some "issue" or "injustice" or, to be frank, something that he thinks will rally support from some special interest group (or a coalition of them) to get him elected. Once at the office, a programme with the aim at solving the "issue" is carried out. Then, because it is government nonetheless, the programme fails to accomplish its objective. Does this mean the politicians and bureaucrats acknowledge the errors of their ways and decide to shut it down? Definitely not. They just declare the programme lacked sufficient funds and resources. Hence, the government keeps on growing and those "issues" are yet to be resolved. Nevertheless, this enlargement takes its toll on the economy and our liberties and, therefore, on people's well-being. In the end, everybody is made worse off. Firstly, let us find out the rationale behind MMT. For the modern monethary theorists, all of their reasoning derives from looking at how the GDP statistic is calculated and then playing around with equations to show that private savings are somehow the function of government spending. It all boils down to this equation: G-T=S-I. To understand what this means, we have to go back a few steps. As every Economics graduate knows, there are three approaches of measuring GDP: income, expenditure and output. Evidently, the most used method is the expenditure one, which employs the following inputs (next graph) in those two possible formulas. 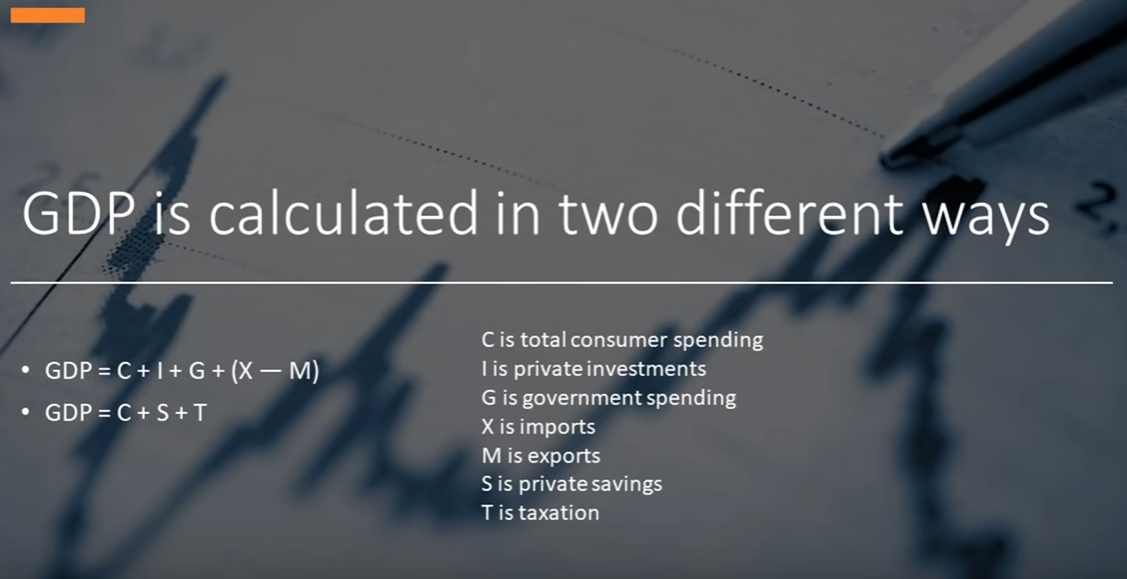 Obviously, these two equations equal each other and we can eliminate C because they cancel each other out. Then, we can take out net exports (X-M) for matters of simplification. Finally, by swapping T and I, we get to the final equation (G-T=S-I). If you prefer, as Robert P. Murphy has put it much more elegantly: government budget deficit = net private savings.
Thus, the MMT-ers are working at an extraordinary level of remove and abstraction from the real economy. All these figures in the GDP calculation are incredibly broad, rough, crude aggregate numbers, which in reality provide us very little about what is going on under the hood. Notwithstanding, turning the absurdity to eleven, they imagine that playing around with aggregate data in this statistical construct, i.e. econometric model, has causal explanatory power in the real world. Without surprise, this has no explanatory power whatsoever. Mulling over this hypothesis, one can plainly appreciate its silliness. In order for you to forego consumption (that is to set aside some portion of your wages for a rainy day, for instance), you require the government to employ people to dig a ditch or build a bridge. Of course they do not present it in this manner. By surveying them about this, they would say that in aggregate if you add up all of the savings of all the people, then you will get a bigger number were the government to spend more on boondoggles. In short, the story goes like this. For a start, supposing the government concentrated all its efforts solely on ditch digging and bridge building programmes. This would of course affect the prices of all materials used for these public works, such as shovels, helmets, steel, etc. Moreover, the ditch diggers and the bridge builders get paid, making them the first receivers of this freshly-created currency. Accordingly, they get to buy consumer goods first and then the money ripples through the economy. Ergo, the inflationary impact takes root, prompting prices to rise across the board. Due to inflation, people's savings, especially fixed-income, are reduced in real terms. On the flip side, the diggers and the bridge builders got to enjoy cheaper items at the expense of other people's savings. The latter have been made worse for the former cohort's benefit. In effect, it is a redistribution scheme from the public to the government's contractors. As a result, far from increasing aggregate savings, this policy will hurt savers in general. Furthermore, on the one hand, the central banks' monetary policies consist of creating money only on the minds of those in the financial system, as well as the public at large, instead of real, usable money. On the other hand, the government, with its fiscal arm (Ministries of Finance or the Treasury in the US), can actually originate and expand the money supply. Contrary to popular belief, on account of the monetary system being a debt-based one, central banks cannot cause inflation because they are not capable of generating their own debt obligations. All the same, once the deficit spending is implemented, the money supply swells, which alters prices in the real economy. Despite this, there is more to the story. In reality, the outcomes and the chain reaction instigated by government spending are very complex, ending up producing effects that go against what one may initially think. As I have mentioned a few times before, government interventions always brings about a system of pernecious incentives that makes the economy less dynamic due to arising distortions in the production structure (malinvestments). To wit, this meddling by the State has been yielding an increasingly unfriendly landscape for businesses and entrepreneurship, hampering economic development - think about it, shouldn't we all have private jets and flying cars by now -, and has given rise to an ever expanding class of welfare dependents to boot. In such a scenario, how is it possible for credit institutions (banks) to originate loans to individuals and businesses with a devil-may-care attitude? In the pre-GFC era they did and it ended horribly, as you know. Because of that experience, banks have learned their lesson and, as I demonstrated on the previous post, they have since then taken a much safer, risk-averse stance. Regardless, what really grinds my gear is the fact that the MMT-ers think this is some groundbreaking theory. For presumed experts in the field of economics, their ignorance is really astounding - which just goes to show, once again, how economists seldom do economics. For a true (monetary) economist, money has emerged as a natural market phenomena to solve the problem of a barter system having to rely on the double coincidence of wants. Some commodity would emerge, be it shells, precious stones or metals to act as a medium of exchange. For example, this process is at work in prisons where it is often the case that cigarettes come forth as the medium of exchange. However, the advocates of MMT reject this explanation of the origin of money and follow a doctrine known as chartalism, initiated by Georg Friedrich Knapp from Germany, which holds that all money derives from government. Accordingly, all money is fiat money (charta, in Latin), arising out of the government's need to levy taxes. In this view, money is not a commodity, but a function of law. Actually, money comes about spontaneously in the free-market, not by legislative decree. The former approach is exactly how the Eurodollar system came to fruition and we also have the recent interest in cryptocurrencies to prove this. Just ask Venezuelans if the latter approach works. Besides the domestic currency, bolívar, having lost all its credibility owing to its debacle in the last four or five years, their state-sponsored cryptocurrency, Petro, launched in 2018, and allegedly backed by the country's oil and mineral reserves, is used by nobody. Instead of these two, can you guess which currency is favoured? US dollar. Speaking of money, let us resume our discussion about inflation. Curiously, in spite of the MMT-ers and their biggest critics (those on the inflation camp and dollar bears) being so ideologically opposed to one another, they are equally wrong - to be fair, MMT-ers are far worse. For the aforementioned critics, they are sort of right with regard to EM countries, due to what I showed in the January 13 post, when they claim deficit spending to curb an economic contraction or a downside deviation from the potential has a serious risk of opening the Pandora's box of inflation. Nevertheless, considering the developed countries, they are utterly mistaken. As I stated earlier in this post, the gradual encroaching in the economy by the government has led to risk-off, deflationary conditions, provoking a shift from risky assets and investments to more safe and liquid instruments and securities, of which sovereign bonds, particularly US Treasuries and German bunds are the taken as the best. Turning to the MMT supporters, their view is flawed on two fronts. For one, they believe they can get the government to spend limitlessly, because of the printing press, until the economy is growing at full-potential, or as they often call, at full-employment. Interestingly, they use these terms interchangeably as if they are the same thing. In my opinion, this simple confusion is perhaps the main source of this lunacy. Supposing, for the sake of argument, every According to MMT advocate Phil Armstrong, of York College, "[t]he existence of unemployment is clear de facto evidence that net government spending is too small to move the economy to full employment, (...) [the government] must use its position as a monopoly issuer of the currency to ensure full employment." Thus, when the private sector is unable to push the economy to full-employment, MMT-ers came up with the idea of a "jobs guarantee" that provides government-funded jobs to anyone who wants or needs one, begetting a long-awaited boom at last - easy-peasy, lemonsqueezy. However, the spending on such a programme would be curtailed when the economy reaches full-employment, having also the ability to raise taxes if the economy gets "over-heated". As you can predict, it will not become "over-heated". Just because everyone has a job, and owing to being created by a bunch of bureaucrats who are not guided by the profit and price system but by special interest groups, it does not mean these are productive jobs. This brings us to the other flaw in their view. They defend that once full-employment is reached, having been absorbed by that "jobs guarantee" programme, the private sector, on account of being starved for workers and having the government as a competitor in the labour market, will have to increase wages. As one prominent MMT-er stated, L. Randall Wray (on the same article linked above), "if the private sector can match you [the government], then you get into a bidding war and you can cause inflation and you will drive up prices. You can cause inflation, and you will cause inflation, if you reach full employment, and you continue to try to increase spending." Therefore, they reject the notion that inflation is always and everywhere a monetary phenomenon and that it causes distortions in the price system - what I take from this this, inflation for them only occurs when the YoY rate of the CPI or the PCE is above the 2% target, or something like that. MMT-ers argue that inflation only crops up when the supply of goods or labour, or the capacity is filled, is too little to meet the demand for them. Finally, this is the long discredited theory of idle resources, a special from our old chum John Maynard Keynes, back in a new disguised form. As you may be presuming, this theory was demolished almost as soon as it was birthed, although very few people have apparently noticed it. To put it succintly, Keynes' argument may be simplified as follows. Full-employment should be our goal. The market system will not get us there, as a result it requires government help and guidance as well. In practice, this means that government will continually "print money" to reduce interest rates, ultimately to zero if it has to, and also borrow and spend as needed. As he affirmed, "the right remedy for the trade cycle is not to be found in abolishing booms and thus keeping us permanently in a semi-slump; but in abolishing slumps and thus keeping us permanently in a quasi-boom." In a nutshell, this is absolutely absurd. For starters, one cannot create wealth simply by "printing money" or by borrowing and spending funds. Moreover, the real source of unemployment is some disturbance in the price and profit system. Like I pointed out earlier on, the government cannot possibly help matters by intervening in ways which further distort and perturb that system. As a matter of fact, a permanent condition of full-employment is not only indefinable, but also undesirable. In short, unemployment is an inescapable condition of a dynamic economy due to the creative destruction phenomenon, coined by the Austrian economist Joseph Schumpeter. To conclude, Modern Monethary Theory is not some "new economics". It is just a lot of old, debunked ideas, which have been exposed in both theory and practice countless times before. Having been repackaged and rebranded, it has been then sold to gullible journalists and idiotic politicians who have an interest in bribing voters with shiny goodies. To cap it all off, if there is anything as certain as death and taxes in this world, it is that journalists, politicians and the electorate, by and large, proceed to be moronic, no matter how many times these terrible ideas are proven to fail. Consequently, the Blob keeps on growing. Furthermore, while reading this you have surely sensed some familiarity with the MMT thesis, which I have already alluded to. Seeing that this post is getting too long and there is still much to analyse, I will save the rest for another day. Without surprise, due to the 2020 bond bonanza and the vaccine-plus-stimulus-driven inflation euphoria, economists surveyed by Bloomberg were forecasting the 10-year UST yield to reach 1.24% by Q4 2021, from 0.93% at the time that article was written. Of course, since this was cast before the Georgia Senate run-off when it was assumed the GOP was going to keep the majority of that chamber, with the Blue sweep in Congress the expectation for the Treasuries yields are surely a bit higher now. Nevertheless, two weeks ago, on January 12, the yield on the 10-year got to 1.18%, which it could very well be the top for this year. Although there are some who are trying to make a big hoopla about the debts that are coming due this year, it has come largely unnoticed and unworthy of being a topic du jour. At first this may seem positive seeing that analysts and talking heads are ostensibly dismissing the "too much debt/many bonds" concept. Actually, they still believe this, though they think the only way that interest rates are not skyrocketing is because of the large-scale asset purchases schemes pursued by central bankers. Is this so? To begin with, let us check whether or not there is too much debt - considering only US government debt. To be clear, being a free-market advocate and a defender of laissez-faire capitalism, I take the view any government intervention, besides being immoral, creates all kinds of distortions in the economy that hinders economic activity and progress. Notwithstanding, the "too much debt", in this context, is the idea that the issuance of a ton of Treasury securities is going to not only lead to a surge in yields causing the debt servicing expenses to balloon, but also prompting an inflationary conflagration in the economy and the complete destruction of the US dollar. Looking at the chart below, it certainly appears Uncle Sam has increasingly been out of control ever since Ronald Reagan set foot in the Oval Office. After all, the amount of federal debt far exceeds the tax revenue. 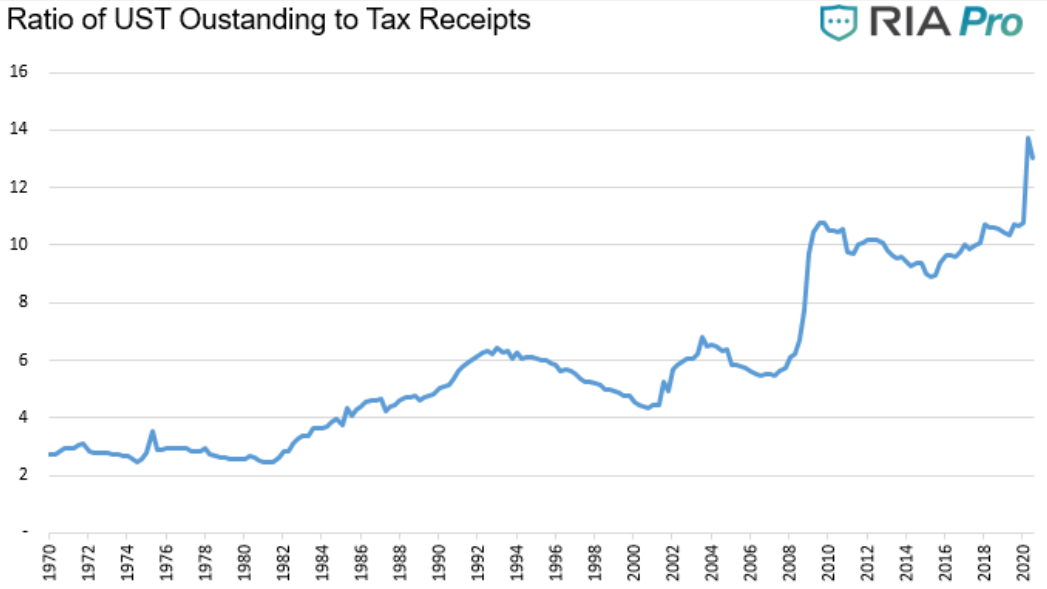 In September, the Congressional Budget Office (CBO) projected debt would rise from over 98% of GDP at the end of Fiscal Year (FY) 2020 to 109% by 2030. Under an alternative scenario where lawmakers enact another $1 trn of stimulus, allow expiring tax provisions to continue, and grow annual appropriations with the economy, debt would reach 121% of GDP by 2030. Since the bottom left chart was published, CBO noted that FY 2020 ended with debt over 100% of GDP. Specifically, FY 2020 federal debt came out at $21 trn, with the debt-to-GDP ratio reaching 100.1%. This estimate marks the first time debt has eclipsed the size of the economy since 1946, when the national debt totaled 106% of GDP (top graph). Congress also enacted another relief package in late December with over $900 bn in additional COVID relief and extending many expiring tax provisions, two of the three elements of this alternative scenario. Prior to the COVID crisis, CBO estimated debt would total 1.5 times the size of the economy within 30 years – well above the prior record of 106% of GDP set just after World War II. Under CBO's latest long-term projections, debt will be almost twice as large as the economy by 2050. CBO estimates that such unprecedented debt levels could slow economic growth by about 20 basis points per year and reduce projected income by $6,300 per person. To make matters worse, debt could rise to nearly 250% of GDP if policymakers allow irresponsible tax cuts and spending increases to continue. 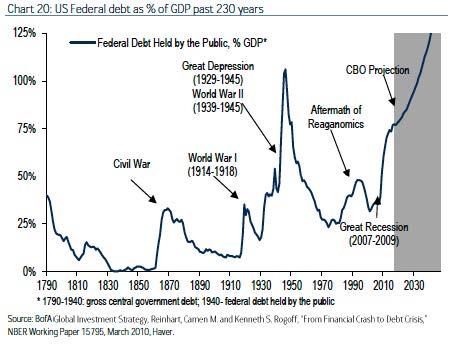
In addition, the foreign holdings of USTs have been dwindling. Particularly, the private holders are apparently - to those on the inflation camp - more sagacious than the monethary authorities, because they are dumping these "toxic" assets before the bond rout commences. Regardless of such putative selling, somebody else has to be buying (with an enthusiastic fervor, no less!). Otherwise, their yields would not have plummeted (next couple of charts). As I stated four months ago, on the October 24 post, "another common argument the inflationists and dollar bears usually make is that the contracting holdings of Treasuries by foreigners during periods of financial distress is proof the dollar is on the brink of losing its world reserve status." I went on claiming that "throughout the March panic, foreigners liquidated some of their Treasuries to satiate their need for dollars, which were extraordinarily scarce at the time. As financial conditions began to improve (because of the economy reopening), their holdings rose, though only up to July. However, at the end of August, the amount went down again, indicating that the dollar shortage is very much present." By glancing over at the most recent data, foreign holdings of Treasury securities continued to diminish up to November. Thus, even with the announcements of vaccine creations and the antecipation of bigger fiscal stimulus (due to the democrats winning the presidential election), the dollar shortage kept on ravishing the global economy.
Like I expounded on that post, the banks are the ones who are leading this epic charge in demand for Treasuries. This is nothing new, as the next graph on the left demonstrates. Once again, we ought to revisit a previous post, this time the second instalment of the Eurodollar system: the untamable beast series - an extremely important reading, btw. "With the growing awareness of the perceived risk in the system, banks started positioning in an ever safer stance. When the GFC kicked off, the primary dealers reversed course and began accumulating US Treasury securities, especially after the Lehman insolvency." Moreover, "[b]ecause structured products that are used as collateral, like MBS, CLO and other ABS, are deemed riskier during periods of financial distress, banking institutions stop accepting them as collateral in the repo operations." This takes us to what the chart on the right implies. Accordingly, "in each episode of financial distress, the banks grew more wary of the risks in the system. In spite of their derivative holdings being reduced after each event, by and large, the banks would eventually return to expanding their derivative activities, indicating the shadow banking system was becoming more vivacious."
Strolling down memory lane, to the heyday of the Eurodollar system, before the GFC brought it to its knees, so much of Wall Street’s efforts during the housing bubble were focused on making markets, or market-based inputs, to price these ABS, like those well-known MBS which were obviously in vogue at that time. In spite of existing several different kinds, what they all have in common is that they transform illiquid assets into a liquid security. Hence, this process is called securatisation. Unsurprisingly, this brings about implications for the repo markets. As you know, the cash owner, the interbank repo lender, wants collateral that is highly liquid because that way the cash owner knows the collateral being received is not going to move much while in his possession. Supposing that someone arrived at the desk of one of those money dealers with a lot of papers holding title to thousands of mortgages. Were the borrower to default by not returning the cash, and the dealer now being stuck with all those individual mortgages, he cannot simply liquidate them tomorrow to get his money back. So as to solve this, these are pooled together in a securitised structure. In fact, it is possible to pool many different types of assets and securitise them: pools of plain mortgages; pools of subprime mortgages; pools of tranched pieces of pools of mortgages, or pools of pools (CDO-squared). What comes out in the end is a security which, if it has a market, then it becomes repo gold. Nevertheless, in order to have a (functioning) market, tradeable characteristics (haircuts, basically) have to remain inside acceptable limits and tolerances. By remaining so, even that toxic subprime mortgage rubbish was acceptable as "pristine" repo collateral. In spite of the whole system appearing to be perfectly safe and efficient, doubts about the quality of the collateral began to emerge, impacting the repo characteristics. If the repo funding begins with an asset like this, it starts out with prices and therefore repo characteristics (haircuts) based on liquid trading. However, in the case of a lot of mortgage-related structures in 2007 and 2008, that liquid pricing just disappeared. To anyone holding the bag (of subprime MBS in this instance), he was left stranded between a rock and a hard place. On the one hand, in view of the cash owner demanding a much greater haircut, if he were to sell this security into an illiquid market, he would take an enormous loss which might confirm to the rest of the world that he really was in tremendous distress. On the other hand, and if he did not possess another type of security that was more repo-able, he could not get the cash to fund his operations. In the end, there was no way out. Although these modern world alchemists seemed to have invented the golden financial setup that easily curbed risk and avoided losses, reality eventually set in. Sooner or later, illiquid assets show their true colours, making the derivative products impossible to use for liquidity functions like repo. Be that as it may, it was only the lower tranches (with higher deliquencies and default probabilities, etc) of these MBS and other ABS that were wiped out. The senior and super senior tranches, on the contrary, never booked cash losses, only price impairments due to illiquid market conditions. During a crisis like the one in 2008, for having an otherwise reliable asset experiencing wild swings in its price - or perhaps no price whatsoever -, that security is no longer repo-able collateral. In such a scenario, were one to dump it, he can only sell it to a vulture fund type for pennies on the dollar, being made to book huge losses that will only make his situation worse. If only he had enough pristine collateral on his books, as a back-up, where he could substitute that unassailable security in repo and, consequently, maintain the funding he needs, burying that illiquid junk somewhere on the balance sheet until the storm passes – and its value goes back up to reflect a more reasonable and fundamental valuation. The question that arises now is which securities are taken for pristine collateral? If you answered US Treasuries specially the T-bills, then you are almost 100% correct. The completely correct answer is on-the-run (OTR) US Treasuries. At any rate, a bond, note or bill just auctioned is the most liquid because it contains the most direct and quantifiable characteristics. Once a security is replaced by the next auction in the series, that security becomes highly liquid OTR, condemning the previous OTR ones into trading obscurity (off-the-run).
The most important lesson that banks and overall financial institutions have taken with them from the GFC is the need to build up a cushion of pristine collateral for when financial turmoil ensues, having the potential to freeze the markets of these risky ABS. Therefore, they better have some OTR Treasuries lying around on their balance sheets, in case markets turn illiquid again. To sum up, they cannot afford being caught without what are, essentially, repo reserves. That is what UST are, or German bunds across the pond in Europe. Basically, these are balance sheet tools and it truly does not matter what their return might be. Ergo, record low and negative yields in Europe and Japan (and the US is surely about to follow). In fact, the credit characteristics of the US government make no difference. The financial institutions hold them in inventory simply because of their liquidity characteristics. That is exactly what the four graphs above reflect: the insatiable desire for pristine collateral. Furthermore, if overseas monetary officials – Foreign Institutions and Monethary Authorities (FIMA) - are outright selling, as they have been pretty regularly for about seven years (like I showed further above), at the very least they are not going to be buying up as much of what is being auctioned. Owing to the way these Treasury auctions work, it would fall to the primary dealers, in addition to the direct bidders (non-primary dealers), which both bid at auction for their own house account, to make up any deficit left behind as FIMA really have retreated from UST. By performing their function as intermediaries, standing between the issuer and the public, making judgements and taking risks so that this absolutely vital (not just UST) financial space and the auctions in it operate without a hitch, the primary dealers will happily absorb the Treasuries they manage to get their hands on. Notice that I said happily and not begrudgingly or something like that. Even though they are obligated to buy whatever is left at Treasury auctions, they do it gladly. After the non-competitive bids get deducted, sorted, and wait to be filled, Treasury then conducts a Dutch tender for the remaining offer. So, primary dealers bid for it, up to position limits, submitting competitive figures for what they think they will be able to profit from: i) for their own house accounts in the sense of their bank book (holding the securities) betting on the price going higher; ii) for what their brokerage network is telling them they can sell off to the public at even higher prices; or iii) for reasons that have more to do with survival (stockpiling OTR repo collateral in their house account), of their own or intending to profit off the survival risks of others (anticipating hefty fees by lending out OTR repo collateral acquired for their house account to other financial firms very likely to be desperate for this exact OTR stuff). As the chart below suggests, despite the record amounts of Treasuries in each successive auction, these securities have no shortage of contenders. Evidently, the supply has been easily met by overwhelming demand, as indicated by the low yields at auction (above graphs), as a result signaling the obvious dollar shortage. 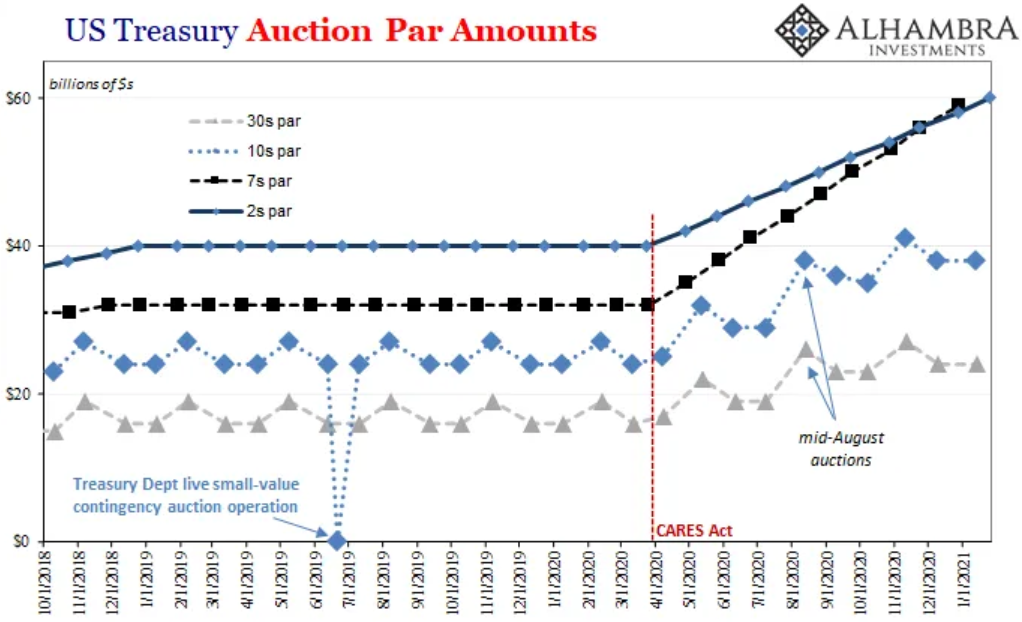 Thus, if the "too many bonds" theory was anywhere close to correct, we would have witnessed the price of competitive bids drop through the floor. In other words, if dealers were getting stuck with UST paper they otherwise did not want, believing this auction stuff to be nothing more than a huge headache, possibly a dangerous problem (the incorrect version of what was going on in repo), then competitive auction bids would have repeatedly reflected such dealer disdain, as dealers would have required lower and lower prices (higher yields) to compensate them for so much alleged pain. Just in case you are wondering whether the dealers or any other bidder is trying to front-run the Federal Reserve and its QE programme, to put it in plain and simple words, the Fed is irrelevant. Surprisingly to most, foreigners matter very little (still more than the Fed, though). One key reason why is that when foreigners are selling their Treasury securities, thus refraining from the same level of UST auction participation, that hints at "tight money" stuff which, rather than being a danger to the UST market, proves to be the reason for heightened demand in it, especially OTR, coming from dealers whose thirst for liquidity appears to know no bounds (top chart). Hence, their holdings of UST continue to mushroom, while the credit origination to the real economy (bottom chart) keeps on the downward trend kicked off in April. 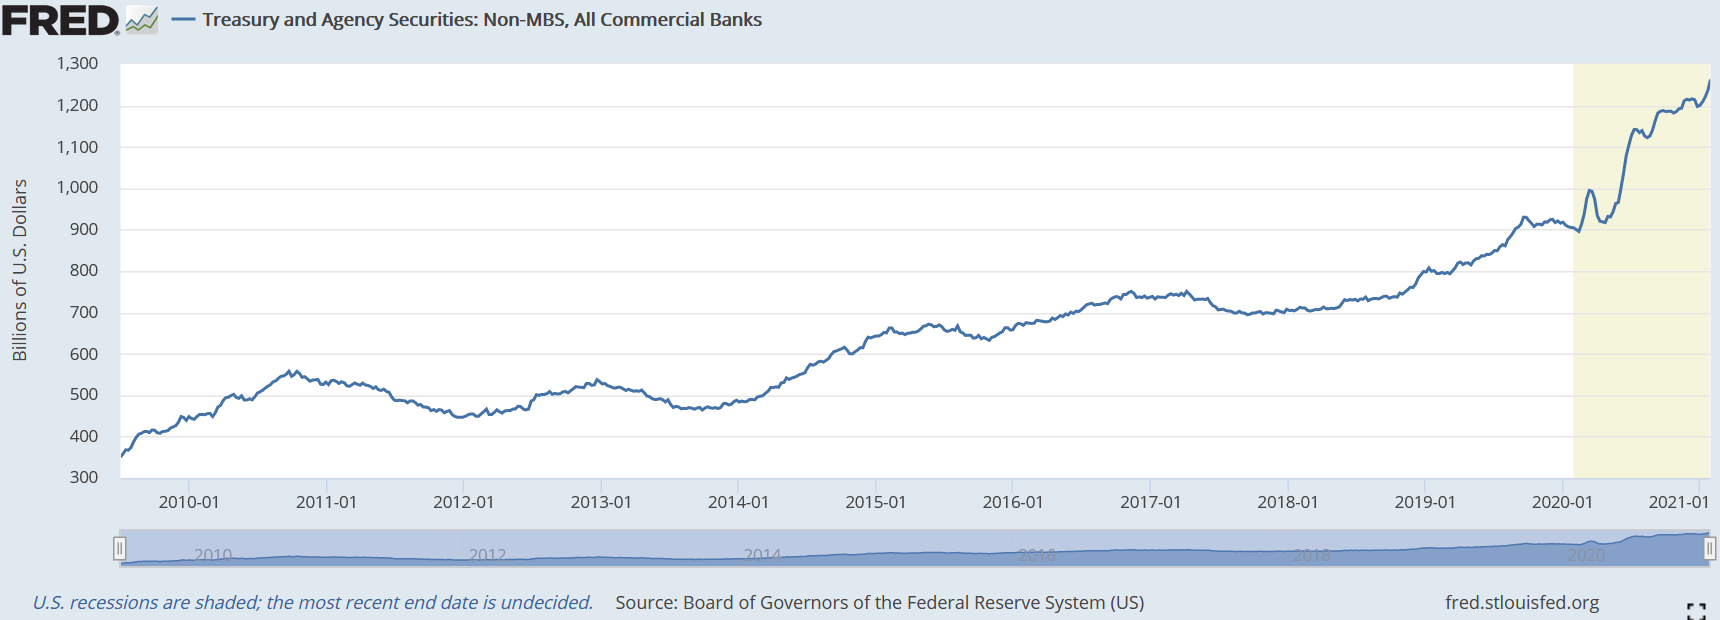 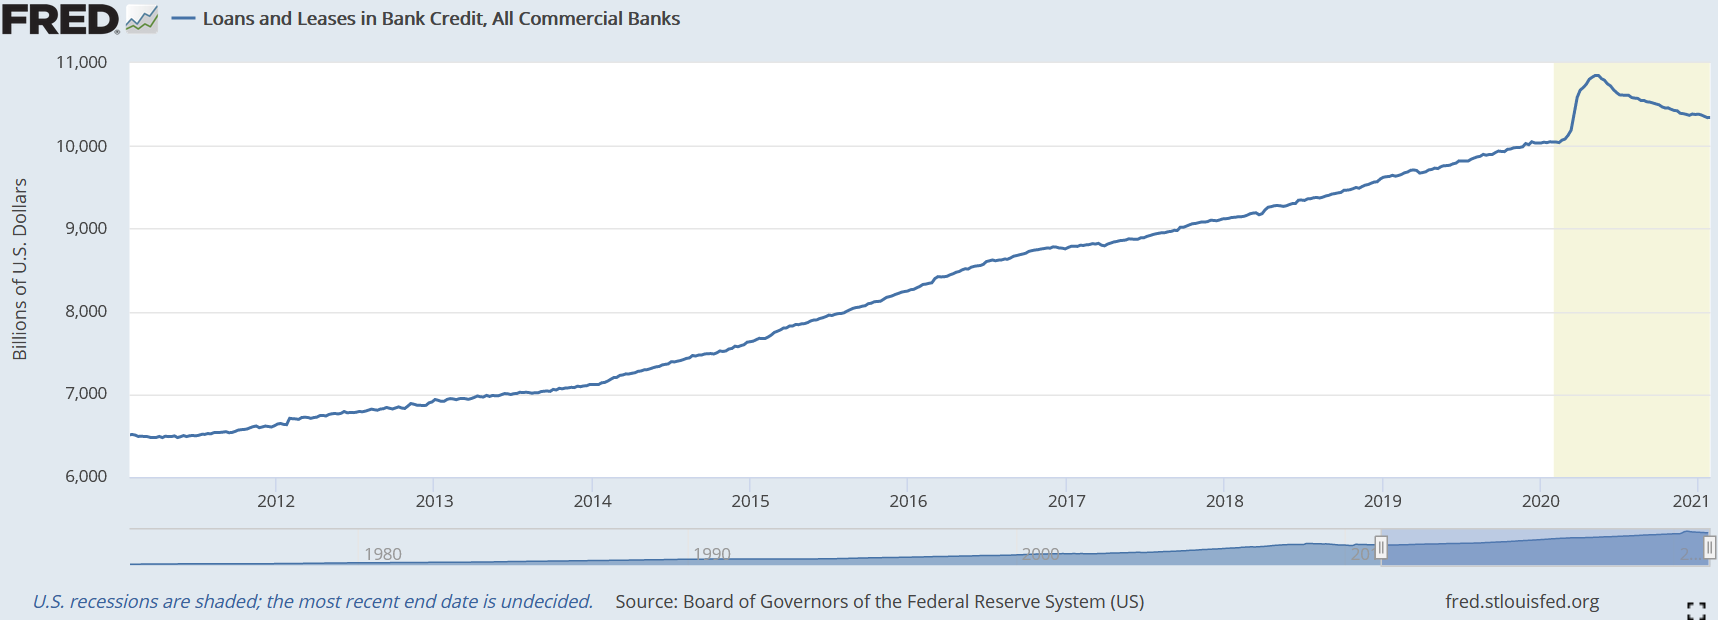 In conclusion, this whole thing reminds of Mr Creosate from Monty Python's The Meaning of Life. Everybody thinks the Treasury market is on the brink of exploding with too many UST. Just one more tiny, little billion dollars for the bond rout and inflation to be unleashed .
Although I am sure there is some breaking point, since after all everything has one, the UST market seems to defy the laws of physics. Nevertheless, it does not defy the laws of (monetary) economics, regardless of what all the analysts and economists spout to the public. Perhaps, it is not like Mr Creosate. Now that I think of it, there is another film that provides a better analogy, The Blob. A theme for another day. To kick off the New Year, the world's largest economies face a massive global debt overhang brought about by the corona-phobia. In round numbers, some $13 trn in debt is coming due and will need to be refinanced in an ultra-low rate environment. Basically, seven top economies plus several major emerging markets "face the heaviest bond maturities in at least a decade, much of the borrowings to dig their economies out of the worst slump since the Great Depression," according to Bloomberg, adding that these governments will need to roll over at least half of this debt in 2021. Although this sounds alarming, I agree with Gregory Perdon, co-chief investment officer at Arbuthnot Latham, when he affirmed that "government debt ratios have exploded, but I believe that the short-term worrying over a rising debt is fruitless." Notwithstanding, I take issue with his other claim that "debt is leverage and assuming it's not abused, it's one of the most successful tools for growing wealth." Undoubtedly debt can be a tool for acquiring or creating wealth. However, when it is government debt that is in consideration, this is only a boon for those well-positioned cronies who have a relationship and are in contact with the legislators or the whole bureaucracy in general. To wit, the largest government debt refinancing will be in the US, with $7.7 trn of debt coming due, followed by Japan with $2.9 trn. To boot, China has $577 bn coming due, Italy has $433 bn, followed by France's $348 bn and Germany has $325 bn. 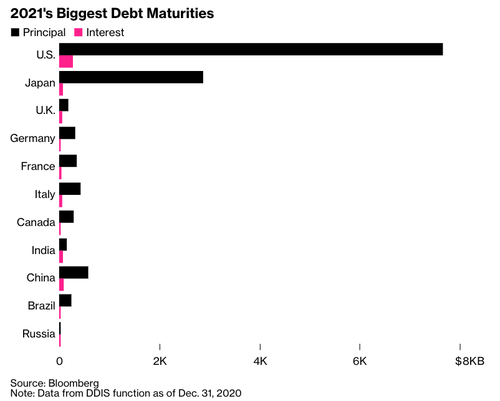 Contrary to popular opinion, the low-rate paradigm is not a product of central banking machinations, but a product of a deflationary economic environment with too much risk for too little reward. Thus, as I stated on the December 30 post, "liquidity has been the top concern for participants in the financial markets (...) Accordingly, investment grade bonds have been an oasis of liquidity during this inhospitable desert that has been the 2020 economy. (...) No matter by how long or how much they do their QEs, credit and "liquidity" facilities, YCC, etc, these are all smoke and mirrors aimed at duping you into believing they possess the mastery over financial markets." Nevertheless, with sovereign yields plunging to record lows, it is only reasonable that governments across the world flood the market with as much debt as possible so as to turn this rebound into an actual recovery - good luck! - or, at the very least, preventing it from rolling over. However, this panorama of ultra-low yields is being experienced almost exclusively among the developed economies. In the emerging markets domain, the contraints on the Eurodollar system, prompted by the colossal loss of activity coupled with tremendous uncertainties about the future, have put these economies under grave peril. In order to have a sense of the vulnerabilities to the current (euro)dollar shortage these countries are carrying, Rabobank has come out with a compelling and succint report on this issue. 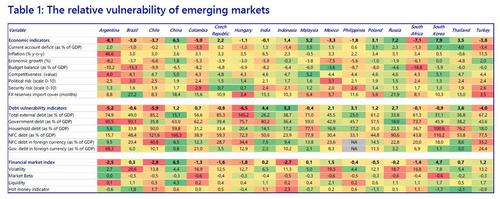 According to this report, the most important factor explaining the rebound magnitude on Q3 (Q2 in China's case) was the level of containment of the virus. Moreover, the countries' dependency on the tourism sector was also detriment for the economic performance on the third quarter, with Thailand and the Philippines having a lousy Q3 figure. On the flipside, countries that either lifted their restrictions on movement and activities or happened to export a lot of in-demand medical and electronic goods, or a combination of both, underwent a relatively robust rebound. In addition, as you can clearly see, the more sluggish economies tended to be the ones in the southern hemisphere where the third quarter lands on their winter season, rendering the best environment for influenza-like illnesses to thrive. Evidently, economic activity remained very constrained in Q3 mainly because of government imposition. 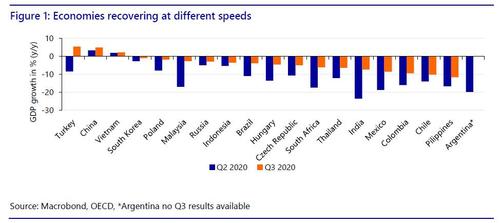 On the left graph (below), in which countries are ordered by their ratios of government debt, Argentina, Brazil and India are the ones that are most in jeopardy of losing control of their finances, solely bearing this indicator in mind - the others being presented by the heatmap above. Seeing that individuals and businesses were in dreadful need of some financial relief, these countries, as was the case all over the globe, have increased their public debt. Among the biggest debtors, Argentina's debt rose 6% of GDP, Brazil 8.4% of GDP and India 8.5% of GDP. In view of the fact that high debt levels are a constraint to future economic growth, they have to be avoided. Furthermore, the governments' capacity to spend could be restricted by higher market-imposed interest rates due to higher default/foreign exchange risks, as well as by a higher share of the government budget that has to be allocated towards debt repayments and not towards "stimulating" the economy. Moving on to debt denominated in foreing currency (below on the right), Argentina, Turkey and Indonesia are the ones most at risk of devaluation of their respective domestic currencies. Even though the writer of the report claims that "[t]his dependence on foreign capital constrains the set of monetary or fiscal mechanisms that can be used to stimulate the economy" and that "cutting central bank interest rates depreciates the local currency, indirectly increasing government debt levels in terms of the local currency", it is better to revisit what I wrote a few weeks ago, on the Christmas day post, to understand the true workings behind these operations and, consequently, comprehend what is wrong with his statement. In the foreign exchange (FX) markets, "these countries' [EM's] currencies are not transacted as much nor are these exalted the same way as the major currencies from the putative developed economies, owing to being less liquid (smaller market with fewer buyers and sellers) and/due to market participants having less confidence and use for these currencies - afterall, this is the Eurodollar system. Hence, the monetary situation in the EMs are extremely dependent on the volume of foreign exchange that goes through their economies, chiefly the US dollar (check out the US vs the World part I and II)." Therefore, the EM central banks are incapable of depreciating their currencies by cutting interest rates. In fact, the plummeting value of an EM currency and lower interest rates are both symptoms of the same condition, the dollar shortage. More of this later on.
Among this group of EM countries, and compiling the data from the heatmap, Rabobank developed a vulnerability score for each economy, which was then disposed in a ranking layout (Table 2 on the right). Overall, Asian countries appear to be the most resilient, followed by the East European ones and lastly those in Latin American, which also carry the greatest political risk, albeit low in absolute terms. 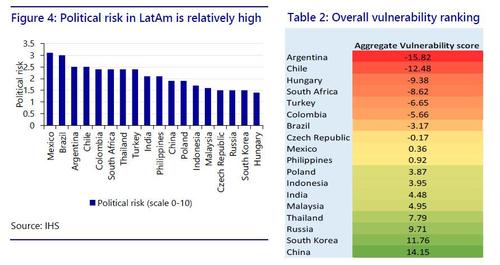 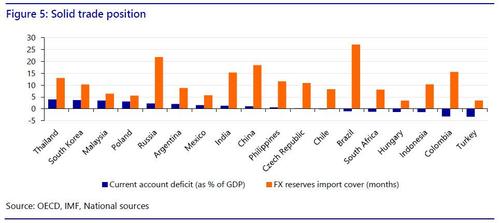 In order to analyse the chart above, let's once more return to the Christmas day post for it kicks off the explanation rather nicely. Keeping in mind that the monetary conditions of the EM economies are based on the flow of FX - US dollar having the biggest weight - in their monetary/banking systems, "in periods of (euro)dollar shortage resulting from global trade contracting (or perhaps just slowing down) and/or financial institutions that take part in the Eurodollar regime being (even more) unwilling, for whatever reason, to supply these very vital dollars (or euros, yens, etc), the banking activity in the form of credit creation is severely impacted in these developing economies." Too confusing? Perhaps I should have started from the beginning. To make this easily digestable, I am going to keep this simple and brief. As you know, money (or currency or credit, whatever you want to call it) is originated by the banking institutions and to some extent the central banks. What's more, because, like I said before, EM currencies are less liquid, these countries are pushed into using the major currencies that have reached the status of global reserves, with the USD being the supreme one. For the sake of argument, and since this is the Eurodollar system, I am just going to consider the USD, though other major currencies, especially the euro, are rather relevant. All the same, insofar the world economy is growing and the global trade is running smoothly, as well as growth prospects are conducive to make the Eurodollar banking institutions willing to provide credit, the amount of dollars that go through the domestic monetary systems of the EMs balloons, leading to more credit creation and, hence, a larger domestic currency/money supply. In turn, their economies can grow. Now I think you can grasp what I said above. As the keynesian textbooks argue for, central banks should accumulate a cushion of reserves, so that during bad times (dollar shortages) they can use them to fulfill the need for dollars (or euros, etc). In spite of sounding reasonable, there are two problems with this reasoning that I am going to demonstrate afterwards. To conclude the report, Rabobank shows the correlation between its vulnerability ranking and the countries' currencies performance ranking. Unsurprisingly, the more vulnerable ones have also experienced the greatest currency depreciation, in general. 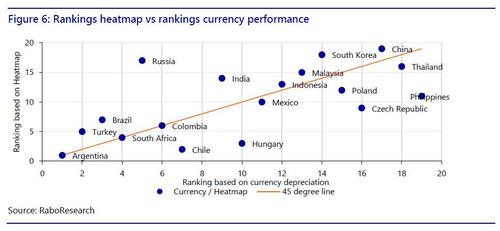 Despite the discovery of multiple vaccines and the promise of unlimited fiscal and monetary stimuli, I am afraid things will first get worse before they start to get better. To be clear, I am refering to the economic and social fabric, not the kung-flu per se, obviously, since it never posed any serious danger. Be that as it may, you may already know how the story goes in the media. To spur the economy for it to get back on track, central banks must cut interest rates so as to increase bank credit to support economic growth. Although that is how it is taught in college and pontificated by the press, in reality the story has a completely different plot. Resuming where we left off in the discussion about the reserves cushion of central banks - once again, considering just the USD. As I contended, two dilemmas arise when a central bank liquidates its dollar-denominated assets, which are almost fully made up of US Treasury securities, to dole out to whatever entities feeling the full force of the dollar shortage. Firstly, as soon as the central bank does this to preclude its currency from depreciating against the dollar, the currency does, in any event, fall. Why? Because the central bank is sending a telegram to everyone revealing that the economy is in trouble and its agents (businesses, financial institutions, households and maybe government) are in great distress. Otherwise, if there were no significant woes, the central bank would stay put. Secondly, and more salient one, these dollar reserves account as assets on the central banks' balance sheets. Ergo, when a central bank decides to pursue that effort, the left side (assets) of the balance sheet shrinks. As a result, the right side has to follow, which means the money supply needs to contract to maintain the value of the currency. Alternatively, therefore, if the diminishing monetary aggregate is to be avoided, then the currency value has to drop. If you thought central bankers in the developed economies were powerless, then what to say about their counterparts in the developing countries. At least Powell, Lagarde, Kuroda and the like can pretend as if they possess the mastery of the economy and the markets. Unfortunately (to them), those poor EM central bankers cannot even do that. Despite all of this, the keynesian perscription continues to be shamelessly put forth, by economists and the media, and sadly put into action. According to the most recent Bloomberg’s quarterly review of monetary policy, "[c]entral banks are set to spend 2021 maintaining their ultra-easy monetary policies even with the global economy expected to accelerate away from last year’s coronavirus-inflicted recession." So many things wrong in such a short paragraph - and that was the first one of the article. To be fair, the writers state that accomodative policies have been hard to pursue by EM central bankers, on account of prices soaring within or above their target ranges. This has mainly been the result of the upswing in the dollar during the March meltdown, which struggled to come down, against EM currencies, to its pre-panic level (next graph). Furthermore, these Bloomberg writers, as is the case with the Rabobank report's analyst, are expecting the dollar to keep plunging. But why should it keep on falling? Before I proceed with the explanation, there is a caveat to consider: the divergence in monetary and fiscal policies will be one of the main drivers in relative performance of the EM local currencies. 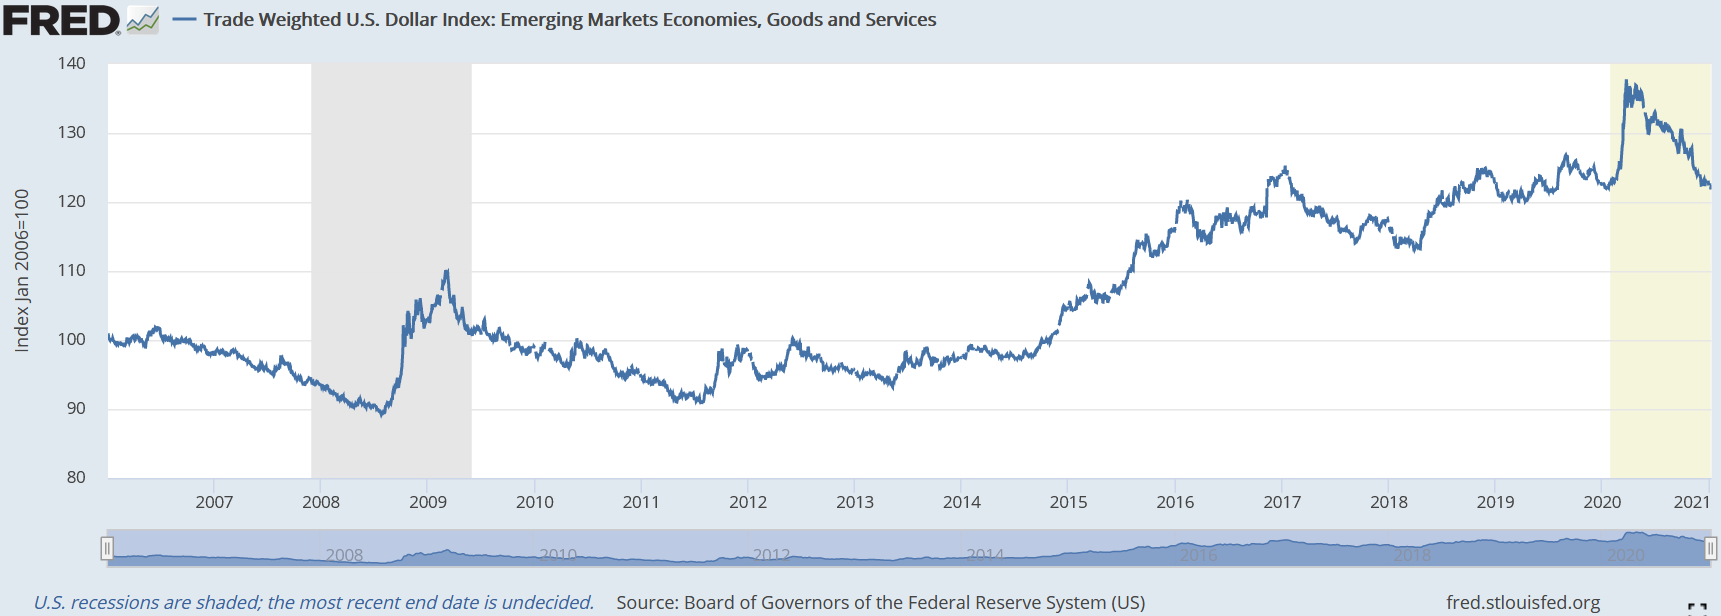 In spite of the monumental magnitude of "stimuli" and the vaccines that will, hopefully, open the economy (if our overlords allow it), the economic depression is going to prolong, for the slowdown - check out part I, II, III and bonus about this - witnessed throughout the summer has extended to the fall, reaching winter to what may turn out to be yet another contraction, particularly in Europe.
At any rate, the EM nations are feeling the stress of the dollar shortage prompted by the economic shutdown and restrictions that followed, with the poorest ones already being in dire straits, as the Washington Post reports. "Thirty-eight low-income countries are either in debt distress, according to the IMF, or at high risk of falling into it. Unless private creditors and wealthy nations step up and agree to concessions or outright debt forgiveness, the pandemic's fiscal shock could hurl some of those, as well as highly leveraged middle-income countries such as Costa Rica, toward catastrophic national bankruptcies." To conclude, and now it all comes together - cue Steve Carell in The Office -, EM economies are stranded between a rock and a hard place. On the one hand, if fiscal and monetary technocrats of some country just sit idly by or close to it, due to being wary of opening the inflation spigots, kind of like China or Russia are doing, businesses and individuals are going to go through a massive insolvency event where they will not manage to service their debts, because they will not be able to obtain the income nor will central banks be inclined to supply the dollars so that the dollar-denominated debt can be serviced. The latter being the essence of the problem being discussed. On the other hand, if the technocrats happen to be overly eager to act, they put their countries at risk of turning into a basket case, like Zambia as outlined in the WaPo article. "The sub-Saharan nation fell into default in November, a result of its high reliance on foreign debt; a pandemic blow to the price of copper, its main commodity; and one of its worst droughts in 40 years. The country is now printing money to survive, forcing a devaluation of the kwacha and creating spiraling inflation that's spreading misery at the worst possible time." Finally, as I proclaimed on Christmas day, there are two ways these countries will end up: "1) a sovereign debt crisis with some high inflation as the ones in Latin America in the 80's or in Eastern Europe in the 90's, or 2) a hyperinflationary crisis of the likes of Venezuela or Zimbabwe that occurred recently." Either way, as you see, culminates in misery and inflation, forget about growth and development. For the time being, though it may last for awhile, that is what the E in EM stands for. As we reach the end of this annus horribilis in which only 99.999% of the world population survived the corona-plague, the time has come to review the most noteworthy events financial- and economic-wise that took place in its span. Before we get down to business, I must warn you that this is not for those whose stomach is weak, as well as those suffering from PTSD from the dizzying trip that was 2020. Now that the disclaimer has been made, let's start. Without surprise, this was the year everybody in the world lost their minds, when paranoia over a novel influenza-like illness, which is not more lethal than the other ones, spreaded faster and more extensively than the kung-flu itself. To add insult to injury, it also brought about more death and misery, through tyrannical and short-sighted measures, than the coronavirus. In fact, scientists have recently come up with studies that reject the ill-founded belief lockdowns were necessary. For example, in one of those, they claim the "stringency of the measures settled to fight pandemia, including lockdown, did not appear to be linked with death rate". As it turns out, the researchers found that the criteria most associated with a high death rate was life expectancy, though higher COVID death rates were also observed in certain geographic regions. 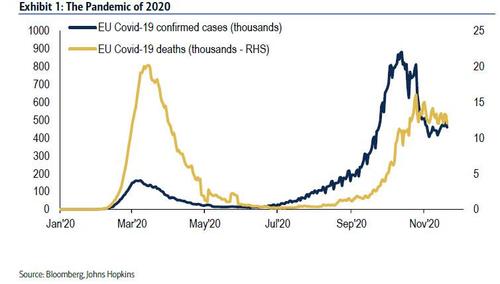 Anyway, back to the memory lane... Owing to the paranoia-induced shutdown of the global economy, the stock markets around the world had their fastest crash in modern history. For the S&P 500 to get to the 20% plunge that informaly marks the onset of a bear market, all it took was 16 (trading) days (bottom graph), on March 11. On the 22nd day, it passed the 30% drop (top graph), on March 19, stopping only on March 23, the 24th trading day. In the end, from peak to trough, the tumble on the S&P 500 was 34%. 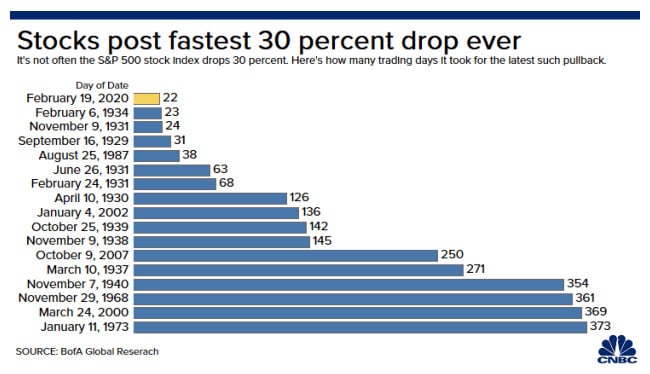 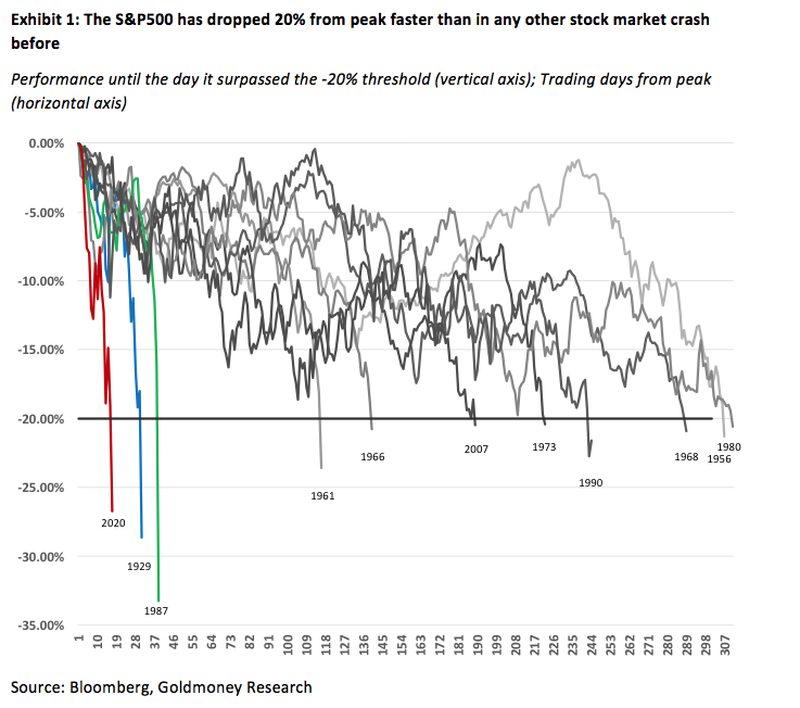 In less than one month, $30 trn had been wiped off the value of global stock markets, one of the greatest crashes of all time in both speed and magnitude - bear in mind next graph from CNBC was made in the middle of the crash, on March 14. 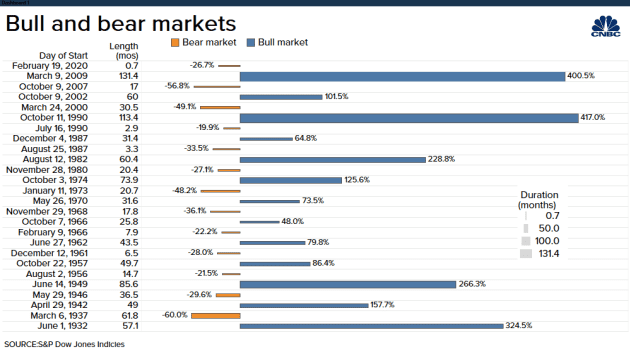 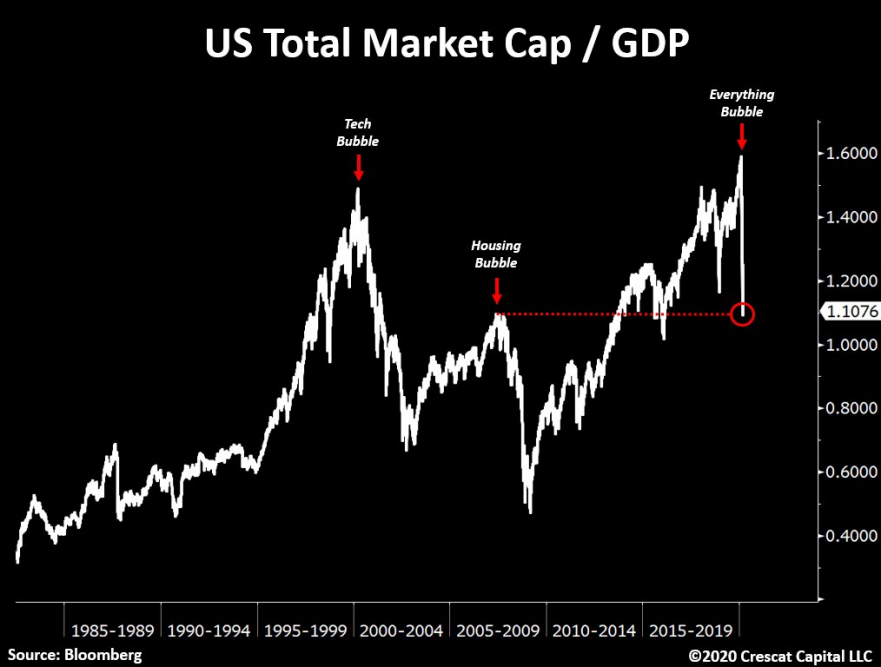 As soon as the plunging Buffet indicator (chart above depicting the ratio of the Wilshire 5000 to GDP) hit the peak preceding the GFC, stock markets roared back. The day after what turned out to be the bottom, stocks had one of their best days ever worldwide. For instance, as shown on the top left chart, the Dow Jones jacked up more than 11%. In addition, the bear market rally was so strong, in the US it turned almost instantly into a bull market. After just three days, on March 26, the S&P 500 was up more than 20% (top right chart). Likewise, the MSCI ACW index (bottom graphs), which tracks the global stocks, being a proxy for the global stock market, rose 16% in just three days.
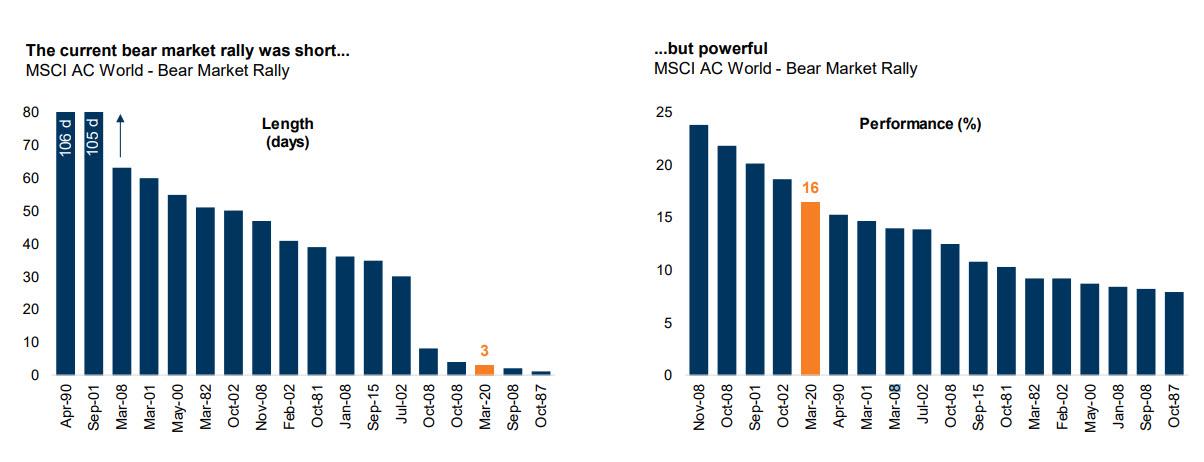 Seeing that the economic and financial collapse was of non-economic nature (but by governments decree), soon market participants made the assumption that once the restrictions were lifted, everything was going to be fine, or even better. Thus, the global equity market cap soared by $40 trn to over $100 trn since the March lows. The rally off the trough has surpassed all of the 4 greatest rallies off the lows of the past century (1929, 1938, 1974, and 2009), with the S&P 500 climbing more than 65% from the bottom. In sum, the yearly performances, from the close on the last trading day of 2019 to this year's last trading day finale, of the various stock markets, per region, are as following: S&P 500 16.26%; Nasdaq 100 47.58%; Dow Jones 7.25%; MSCI Eurozone 5.15%; Nikkei 225 16.01%; MSCI China 26.34%; MSCI Emerging Markets 15.15%; and MSCI ACWI 14.47%. 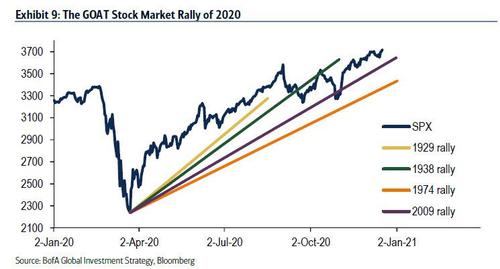 Moving on to the effect of the lockdowns in the real economy. although it was the pioneer in imposing these preposterous measures, as well as being the most stringent enforcers, China was the first country to become more lenient, still being so to this day (left graph). As a result, its economy bounced back the fastest and closer to its pre-corona-phobia level than anyone else. Recently, the regions that are feeling the brunt of the economic shutdown the hardest are Western Europe, Asia-Pacific (mostly Japan, which weighs a lot in this calculation) and North America, in this order.
In spite of collapsing 20% in April, in round numbers, global GDP reversed rapidly, though partially, in the second half, thanks to panicked lawmakers - making them lift restrictions and provide government assistance to counter the economic turmoil and social unrest - and behavioral adaptation. Besides Chinese business confidence slumping to an all-time low, oil prices turning negative, and human "mobility" being ceased (US TSA air passengers -96% YoY in April), on account of the $10 trn wipeout in the World GDP, US unemployment rate soared to 14.7% as 70 million people filed for unemployment benefits in 2020. By the way, US household savings rate jumped to an all-time high of 34%. Other countries laws and ad hoc measures prevented (or made it less desirable for) companies from laying off workers, masking the true devastation of those countries' labour markets. 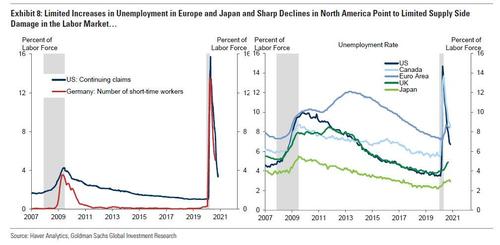 The virus, crash, lockdown and recession provoked an unprecedented monetary and fiscal policy panic. On the monetary front, $22 trn of stimulus has been announced in the past 9 months around the globe. As "fiscal stimulus" is concerned, $14 trn were announced throughout the world to stem the economic depression. Therefore, the quantity of global debt now stands at a record $277 trn. Oddly, the amount of global negative yielding debt reached a new historical figure, $18 trn, as liquidity became the number one concern. Unlike the 2008 GFC, the liquidity crisis did not (or rather has not yet) lead to a solvency crisis (top left chart). Obviously, bankruptcies have been subdued because businesses have acquired massive amounts of debt, either through bank and government loans or through the corporate bond market (like I showed in the previous post), and the imposition of debt moratoriums and other kinds of government assistance. Furthermore, the US government transferred $2 trn directly to the household sector (bottom graph) in 2020 and American consumers demonstrated how strong (or reckless) they are. However, both Wall Street and Main Street addiction to government bailouts is now habitual. 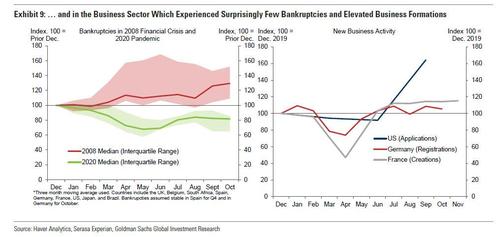 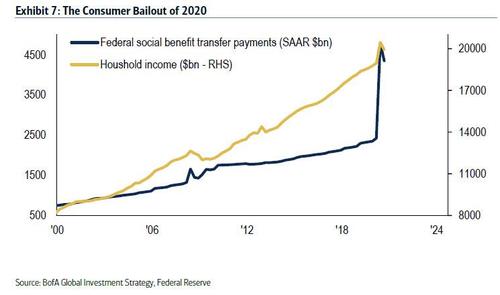 The capitulation of consensus to "don’t fight the Fed", the front-running the MMT boogeyman and the secular tech-led productivity sound like they may be some of the myriad of catalysts for more years of big equity gains. I beg to differ. Notwithstanding, Wall Street in 2020 was also marked by a significant polarisation of returns. In recent months, the top 5 companies in the S&P 500 represented a breathtaking 25% of the index (bottom left graph). What's more, owing to the euphoria surrounding the US election results and the vaccine breakthroughs, November experienced the greatest monthly gain for global stocks (top left chart). In a nutshell, due to the increased role of governments in the economy, reducing its dynamism and entrepreneurial activity, the pace at which it grows and the inclusiveness (proportion of workers/consumers/investors sharing its gains) of its development dwindle in return. As the Leviathan (government) keeps getting bigger, the less the lower echelons of society benefit from technological progress, while the top echelons acquire an even bigger share of the pie. Unsurprisingly, this year proved this with inequality cranking up. Comparing Wall Street to Main Street, the bottom right chart shows extremely well the divergence between the financial economy (easily and publicly transacted, ergo more liquid) and the real economy. Hence, in the US, the value of financial assets relative to the economy hit the all-time high of 6.3x.
No comment... 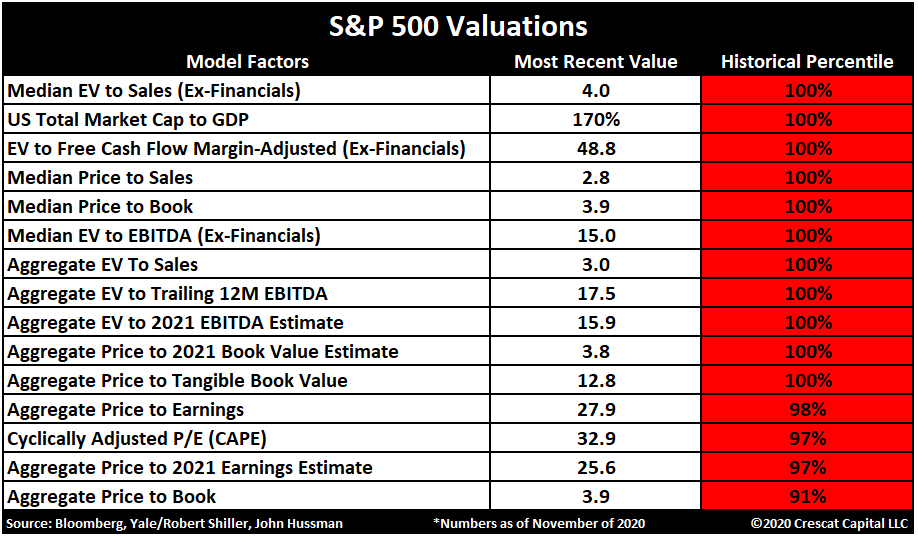 Revisiting the central banks' actions, you can see they have been very busy. Of course, everybody assumes they are relevant, very much so. The over $1 trn a month of purchses of financial assets via QE have surely precluded the implosion of the global financial system, in addition to not only prompting this unprecendented stock market rally, but also keeping yields in check. This time is for real. All that fiscal and monetary recklessness are going to precipitate the long-awaited inflation (bottom left chart). Needless to say, I would not count on it/them - check out the series about the vaccine-induced euphoria (part I, II, III and bonus). 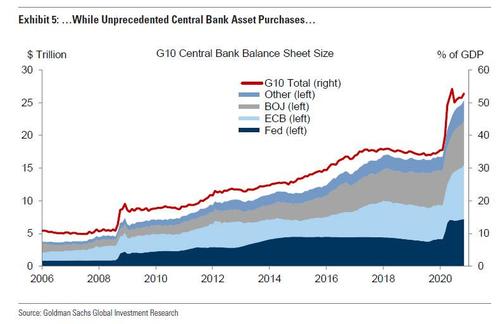 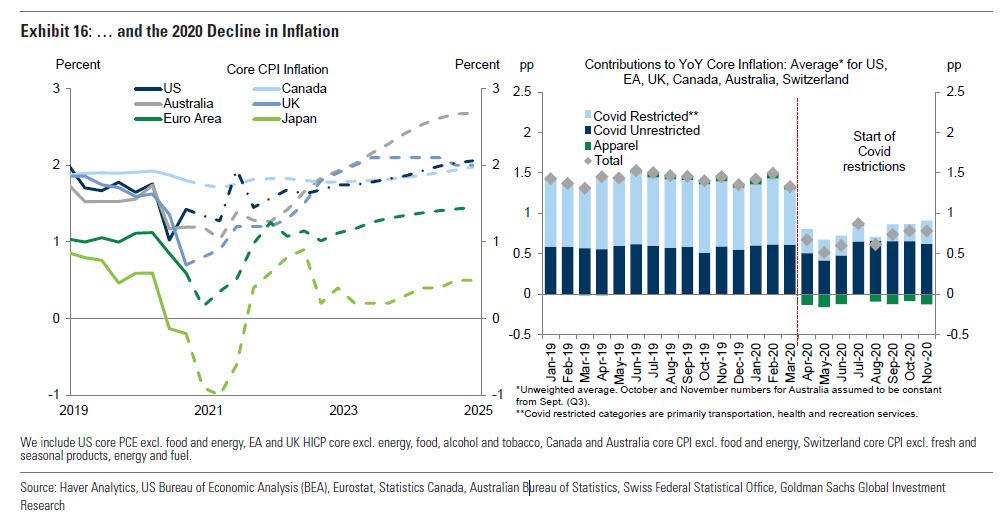 In conclusion, 2020 will, in my opinion, be remembered as the year irrationality and hysteria run supreme. Naturally, several lessons can be taken from this, and we must learn from them so as not to repeat them. For now, all I will take are some remarks. Without a shadow of a doubt, the biggest one being how willing people are to give away their liberties (even to breathe unhinderedly), while blindly trusting the authorities. Really scary stuff! Unless we go through an ideological revolution, the coming years will be marked by bigger government and central banking trickery, hopefully for nothing more than attempting to get the economy to full-employment level (whichever that one is) and "inflation" to the 2% YoY target (for whichever reason. Nevertheless, I take the view they will achieve just the opposite, while simultaneously taking away even more of our liberties and encroaching on our freedom. All the same, as it is tradition, as my solemn New Year's resolution, I promise I will continue making the effort to deliver the most coherent, data-driven and insightful commentary on the state of the economy and on financial affairs as possible. If only the (financial) media could do the same... 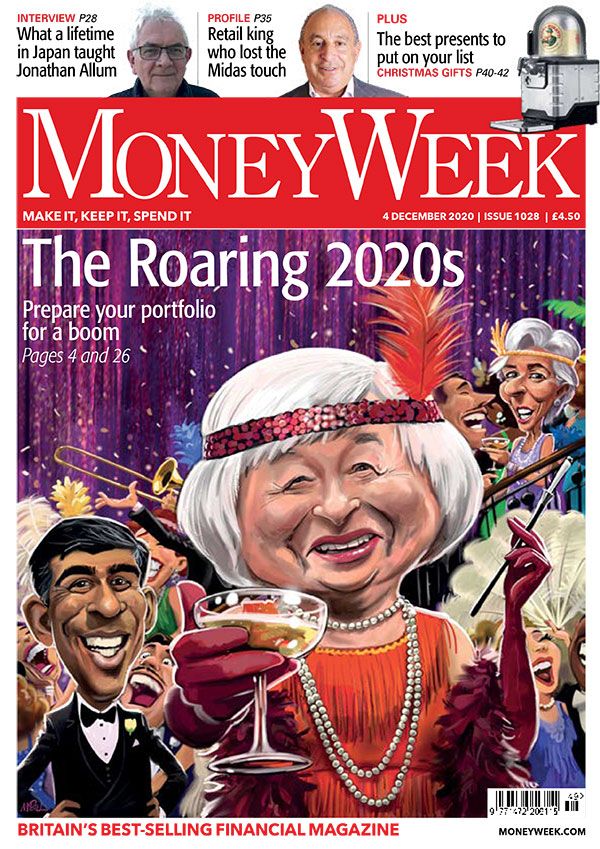 Following the discussion introduced in the previous post about the record amount of worldwide total debt, with a special focus on the governments' debt, today I am zooming in on the realm of businesses. To be specific, the corporate bond market. Regardless, let's first zoom out and take a bird's eye view of the broad bond market. In this way, you will have a comprehensive grasp of what bonds are suggesting, although you should have an inkling of what they have been hinting at - certainly, you will know by the end of this post. On account of a massive deflationary environment brought about by the hysteric corona-phobia, liquidity has been the top concern for participants in the financial markets - in the real economy too, though this analysis does not concern them. Accordingly, investment grade bonds have been an oasis of liquidity during this inhospitable desert that has been the 2020 economy. Evidently, yields have been falling all around the globe to an even lower level than at the onset of the March meltdown, averaging roughly 0.9%. On the same note, the amount of debt carrying a negative yield has surpassed the record set in 2019, reaching the $18 trn mark. To boot, the Fed nor any other central bank is the culprit for this so-called "financial repression" - inflation above interest rates so that the debt-to-GDP ratio gradually comes down. No matter by how long or how much they do their QEs, credit and "liquidity" facilities, YCC, etc, these are all smoke and mirrors aimed at duping you into believing they possess the mastery over financial markets (Eurodollar system: part I, II, III and bonus). 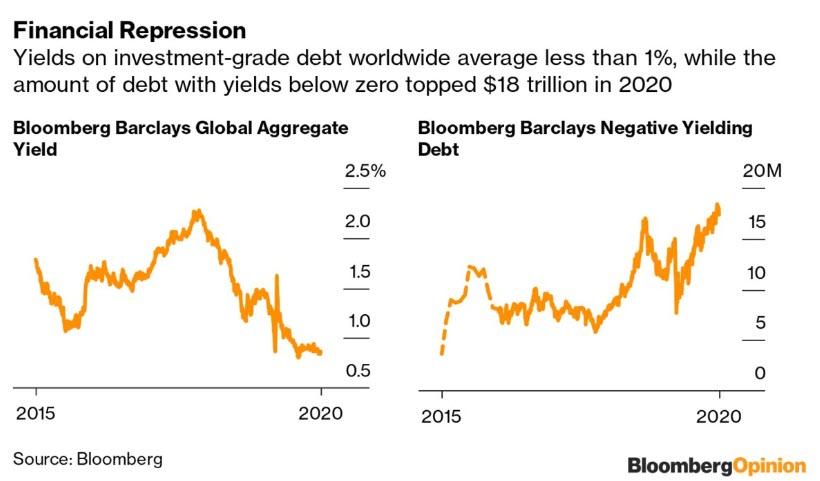 Of course, nobody wants to own bonds that pay next to nothing, or even negative rates, unless they have to for regulatory or other reasons. Hence, it is true there has been a scramble for yield, primarily for the debt obligations of companies and others with below-investment-grade credit ratings, which partly explains the historical strength of the HY bond market. However, I would argue that this market's performance has recently been a victim of the reflation narrative caused by the vaccine development and stimulus exultation. To sum up, due to liquidity concerns and then the reflation fantasy, rising demand pushed yields on bonds issued by these entities to a record low 4.59% worldwide on average. Even so-called frontier nations such as Ghana, Senegal and Belarus are benefiting. Furthermore, the graph on the right depicts extremely well this rush for safety I have been expounding. As you can imagine, the US Treasury debt has a considerable share of the global bond market. Therefore, the big shift that occurred this year, in relation to 2019, from the 1-2% yield range to the 0-1% range, was in large part because of the belly of the UST yield curve (2-year to the 10-year) dropping like a rock in Q1. Overall, the 0-1% bucket has surged from 15.7% to 44.7%, approximately. According to Deutsche Bank calculations, only 14.9% of global bonds have a yield above 2% and only 9.9% carry one above 3%.
Meanwhile, thanks to liquidity preferences in such a sterile environment, there is an almost record-high level of EUR IG bonds with negative yields. As the following chart on the right shows, as of December 15, 41% of the EUR IG iBoxx index yields in sub-zero territory. This is a level that matches the previous record in August 2019. Even more impressive is the fact that more than 10% of the index now yields below -0.25%, according to the annual recap note published by Goldman's chief credit strategist Lotfi Karoui. Similarly, the US corporate bond market is still somewhat more normal than the one in Europe, it too is starting to Japanify, with USD IG real yields (below on the left) turning negative. This means that while most of the focus on negative yielding corporate debt has been concentrated on nominal yields in the EUR IG market, real yields on USD IG corporate debt have also turned negative for the first time in history.
Although the Fed’s announcement has apparently triggered a swift recovery of the new issue market, especially in HY where activity had been paused for a few weeks in March, the Fed’s purchases have been largely symbolic – consistent with a lender of last resort posture. Some have argued that the market's trust on the ability of the Fed to step in "in size", if and when necessary to buy everything, was all it took to restore the normal functioning of these markets. To put this in context, since the Fed's Secondary Market Corporate Credit Facility (SMCCF) buying started in mid-May, a tiny $14 bn of bonds and ETFs (below on the left) have been purchased on a combined, cumulative basis, while the size of the US Investment Grade market is more than $8 tn and the SMCCF eligible universe has a total face value of $1.9 trn (and $520 bn when applying the SMCCF program purchase limits, such as issuer constraints). As a testament to the Fed's jawboning, in recent months the amount of SMCCF purchases has been tremendously light, as the program nears its expiration on December 31, 2020. Notwithstanding, despite the Fed's corporate bond purchases being modest, the same can not be said of Europe, where first Mario Deaghi and then Christine Lagarde have been on an epic bond binge. As a reminder, the ECB started purchasing corporate bonds well before the Fed in March (it did however accelerate its pace of purchases after the March meltdown). As a result, the ECB now owns a record 8.5% of the entire EUR IG market. As Goldman calculates, the ECB continued to deploy its balance sheet in the corporate bond market, growing the size of its portfolio to €272 bn, €251 bn under the CSPP and an additional €21 bn under the PEPP. This compares to €185 bn at the start of the year, and is 24 times more than the Fed's purchases of corporate bonds. In other words, whereas the Fed successfully managed to jawbone the bond market into a state of confidence, where prices do not fall even when the Fed barely transacts, Europe has failed miserably, and bond market participants have now habituated to the ECB buying billions every week - so the story goes anyway. On this account, the ECB currently owns 23% of the eligible universe of securities and 8.5% of the broader universe of EUR IG corporate bonds outstanding.
As Goldman declared, the "pandemic pushed market microstructure to the brink of collapse" and at the height of the COVID-19 hysteria, "the USD corporate bond market teetered on the brink of collapse as liquidity dried up faster and more severely than it had during the Global Financial Crisis". The chart below shows just how dramatic these moves were. In just a few short weeks, we went from a well-functioning and relatively liquid market, to the exact opposite as we entered non-linear territory. Then came the day which will live in central banking infamy - March 23 - the day the Federal Reserve announced its "novel" Corporate Credit Facilities, and coincidentally just as fast as liquidity had dried up, it returned. For believers in the central banking mastery, the announcement the Fed would buy corporate bonds in both the primary and secondary market, including investment grade and junk bond ETFs, coupled with the direct injection of over $10 trn in "liquidity" by central banks in the span of just weeks after the March crash, has precluded the collapse of hundreds of trillions of dollars in rate-linked securities. Ergo, the corollary being if the Fed had sat idly by, the western capital markets would have imploded. 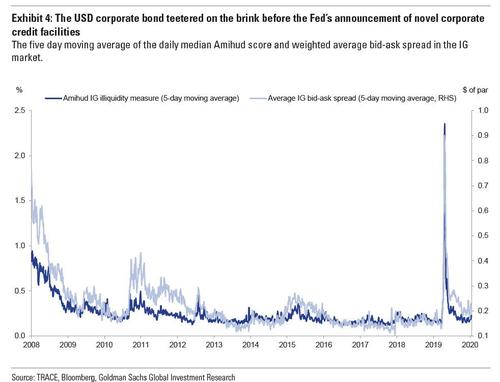 A new corporate debt issuance record was set when ten IG bonds priced for $6.85bn on September 29, shattering the monthly sales record for the sixth time in the last seven months. The borrowing spree comes on the back of a lockdown-fueled liquidity grab, as companies sell record amounts of debt at all-time low yield, using the proceeds either to refinance existing debt, maybe to resume buybacks, but mostly to get a comfortable cash cushion. The September monthly IG supply stood at $162.7 bn, passing the $158 bn record total for the 2019 September. Until then, July was the only month since March not to set a new high water mark for the respective month, according to Bloomberg. Despite the record YTD (till September-end) new issuance momentum, supply has slown into year-end with just $150 bn expected in 4Q, down about 20% over the same period last year, as most companies that could take advantage of the wide open issuance window have already done so. This year saw the average duration of the USD IG market materially increase, further extending a trend that started in late 2018. This increase reflects the proactive behavior of corporate borrowers which have been taking advantage of low yields and strong investor appetite to bolster their liquidity positions and extend the duration profile of their liabilities. The flipside of this tailwind for issuers has been a notable increase in the risk profile of IG portfolios. 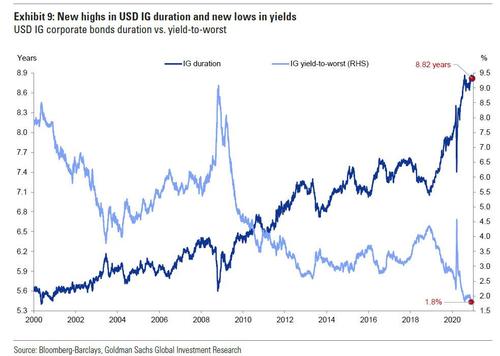 Likewise, the HY new issue market has been surprisingly receptive to a wide range of sectors since its "re-opening" in late March – including those groups at the epicenter of the corona-phobia disruption. The chart below illustrates this by showing monthly USD HY gross issuance volumes by four broad sector categories: 1) commodities related; 2) government supported, under the CARES Act; 3) directly disrupted by the coronavirus/sudden stop in the economy; 4) and indirectly impacted. 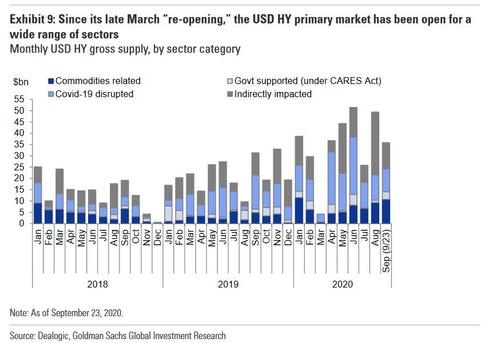 As the above chart shows, directly disrupted and government supported sectors have generated significant amounts of supply in each of the past few months, indicating the market’s continued willingness to lend to groups facing persistent headwinds related to social distancing and business restrictions. Once again, the reason is not the Fed's explicit backstop of the corporate bond market since March, when Powell announced the Fed would purchase corporate bonds and ETFs, but the flight to liquid instruments. In fact, on the prior week, September 23, before the US IG bond market smashed the annual issuance record, sales of high yield - the term is used very loosely these days - debt hit a record $330 bn, surpassing the previous full-year record of $329.6 billion in 2012 (with still three more months to go in 2020). 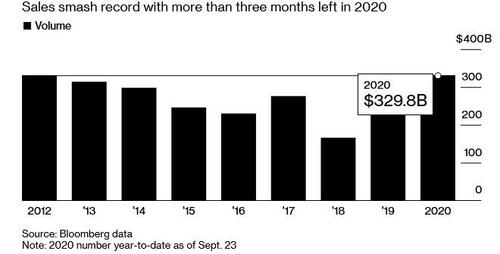 In a nutshell, the sudden stop in global economic activity and the subsequent policy response sparked the fastest drawdown and recovery in the three-decade history of the USD corporate bond market. This is illustrated in the next graph, which plots the 20-day excess returns on IG and HY cash indices since 2000. While spreads peaked at tighter levels relative to the Global Financial Crisis, the velocity and the magnitude of the downward move was quite comparable, having been even worse now in IG. Ostensibly, as they would have you believe, owing to the strong policy response (both on the fiscal and monetary fronts), the speed of the recovery was even faster than in the aftermath of the Global Financial Crisis. As a matter of fact, since the Fed’s announcement of the Corporate Credit Facilities on March 23, the IG and HY bond markets have rewarded investors with cumulative excess returns to Treasuries of 20% and 28%, respectively. 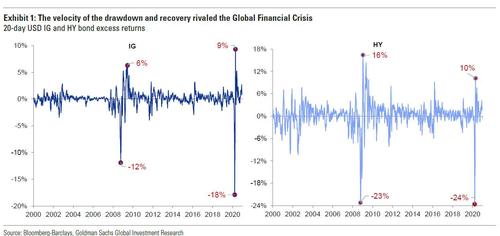 Moreover, the global capital markets business, such as equity and debt sales, has erupted during the pandemic. Given that liquidity has been the top priority since the corona-phobia began, it was not hard for a large corporations to conduct an equity or debt deal. As a result, investment banks earned a record amount in fees for underwriting various types of deals. According to the Financial Times, 2020 was a record year for companies raising more than $5 trn in debt markets. Naturally, all that money raised means corporate banksters were able to collect handsome fees. "While multinationals first moved to draw down credit lines in March, they quickly shifted to the bond market to lock in longer-term funding," affirmed the FT. In the end, investment banks earned about $42.9 bn underwriting debt deals, up 25% over last year. In addition, David Konrad, an analyst at DA Davidson, said that through equity offerings corporations managed to raise $300 bn this year. In terms of IPO fees, the revenue from underwriting initial public offerings jumped 90% to $13 bn, the highest since the end of the Dot Com bubble (2000). Overall, equity underwriting revenues nearly doubled this year to $32 bn from 2019's $18.3 bn. By the way, compared to last year, merger and acquisition advisory fees fell 10% to $29.6 bn. In total, investment banks across the globe generated a record $124.5 bn in fees this year as companies desperately raised cash to survive the pandemic and, more importantly, whatever scenario lies ahead. Finally, as you can see on the graph on the right, the biggest Wall Street banks (JPMorgan Chase, Goldman Sachs, Bank of America, Morgan Stanley, and Citigroup) earned a combined $37 bn in investment banking fees this year, the highest in more than a decade.
To conclude, because corporations have long ago realised they cannot depend on the banking sector nor, particularly, on the Fed or any other central bank to get their liquidity needs satiated during financial panics, they spent the immediate months after the March meltdown hoarding as much cash as they could.
Even though monethary authorities have been very active cunning the public, with the help from the media and economists, their efforts have been simply irrelevant to bring markets to normalcy. Just think about it. If central bankers are really at the helm of the markets, and the economy as well, would the March meltdown even happened? Since Christmas is the time of giving and being with the ones you love, I thought this most wonderful time of the year was also the most appropriate time to check what the ones that give and love the most had done this year to show how much they care about their fellow man. Obviously, I am talking about our warmhearted politicians and technocrats. Albeit a lot could and, in due time, will certainly be said about the governments' (over)reaction, all over the world, to the kung-flu, on this post, I am only going to consider the fiscal side, the debt, which was record-breaking. Notwithstanding, despite all the hardship that this year presented us, individuals (households) and businesses (non-financial corporations) have indulged on a borrowing binge never before witnessed on a global scale. In a nutshell, the growth of total debt worldwide, since the paranoia-driven economic shutdown in March, has been alarmingly strong because "the pace of global debt accumulation has been unprecedented". Accordingly, up to the third quarter of this year, total debt surged $15 trn, which adding to the previous three years totals $52 trn, the Institute for International Finance declared. In relation to the previous four-year periods, this is the first time debt growth has accelerated since the GFC. To be specific, the biggest contributor to make this debt increment a historic one has been China. In spite of increasing their debt levels in the last four years, neither one of the other aggregates has increased its debt by a record amount. Shifting our attention to the chart on the right, one can clearly notice the total debt growth has kept pace with the expansion of the output. In fact, global debt in percentage of global GDP had been fairly consistent since 2013 till the first quarter of this decade, skyrocketing in the following two quarters, reaching the all-time high of $272 trn in Q3. What's more, the global debt is expected to soar even more by the end of the year to $277 trn, which would represent a debt-to-GDP percentage of 365%.
Moreover, the debt build-up has been different among countries, in both quantity and quality, especially between developed and emerging markets. On the one hand, in the DM realm, governments have been the main driver of debt accumulation, particularly in Europe, counting for nearly half the upturn. However, more remarkably in North America and Japan, non-financial corporations have really gone at it this year, with households surprisingly joining the party (to some extent). Among advanced nations, total debt surged above 432% of GDP in the third quarter, a 50 percentage points hike from 2019. In more detail, government action in the EA led to an increase of $1.5 trn in public debt this year alone, to reach $53 trn in total debt. Across the pond, total US debt is forecasted to swell $9 trn through the full course of 2020, hitting $80 trn by the end of the year. On the other hand, the greatest borrowers among emerging nations have in general been the businesses, though governments have not been far behind. Approximately, total debt-to-GDP ratio of the entire aggregate has swollen 25 percentage points to 248% by the end of the third quarter, very much skewed by China's 335% ratio. As I demonstrated on October 24, the "surge at the beginning of the pandemic is explained by the rolling out of lines of credit directed to businesses [from banks and governments] in order to keep up with current expenses, such as salaries, rent, etc., by making up for the diminishing revenues".
On a sidenote, the point has to be made that the EMs' businesses have been taking the brunt of the hysteria-induced economic collapse on account of their governments not having the creditworthiness of the governments in the West. Besides, even more overriding factor, these countries' currencies are not transacted as much nor are these exalted the same way as the major currencies from the putative developed economies, owing to being less liquid (smaller market with fewer buyers and sellers) and/due to market participants having less confidence and use for these currencies - afterall, this is the Eurodollar system. Hence, the monetary situation in the EMs are extremely dependent on the volume of foreign exchange that goes through their economies, chiefly the US dollar (check out the US vs the World part I and II). In turn, in periods of (euro)dollar shortage resulting from global trade contracting (or perhaps just slowing down) and/or financial institutions that take part in the Eurodollar regime being (even more) unwilling, for whatever reason, to supply these very vital dollars (or euros, yens, etc), the banking activity in the form of credit creation is severely impacted in these developing economies. As a result, the economic activity decelerates or contracts, if there is too big of a shortage, because of deflation - the true definition, not the keynesian. Now that I am through with all the explanatory notes, I think it is rather evident why the EMs have what appears to be a fiscal musket compared to the DMs' fiscal bazooka. Basically, the poorer the institutional framework (rule of law, economic freedom, transparency, accountability, etc), the less creditors trust the country and, thus, the more he is wary of lending to that country. Ergo, a higher premium for the inferred risk is demanded, leading to higher interest rates and more pricey interest expenses. To make long story short, the endgame could be 1) a sovereign debt crisis with some high inflation as the ones in Latin America in the 80's or in Eastern Europe in the 90's, or 2) a hyperinflationary crisis of the likes of Venezuela or Zimbabwe that occurred recently. 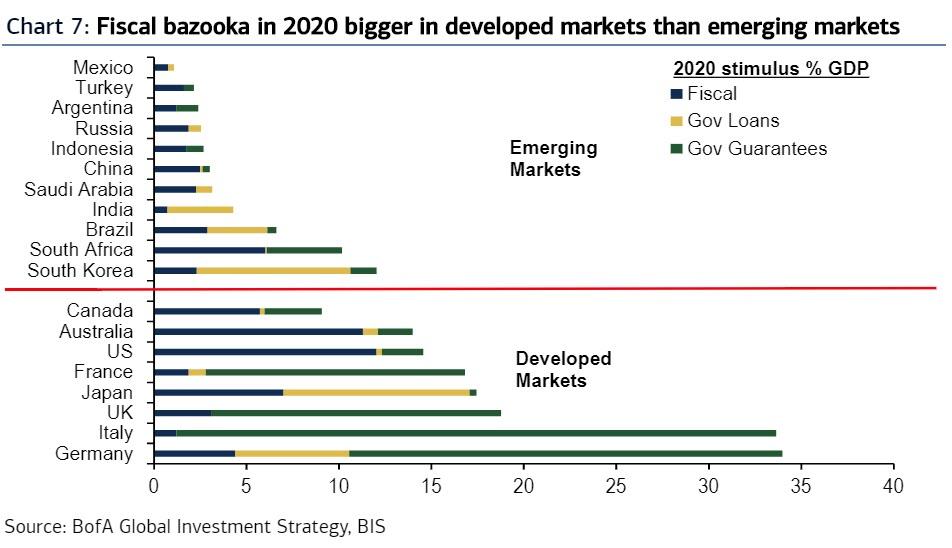 Furthermore, seeing that the monetary system is debt-based, the amount of credit has to balloon relentlessly so as to keep on the expansion of economic activity, as well as to stave off the otherwise inescapable financial and economic turmoil - FYI, in a "hard money" system, the output can increase without the debt/money supply ramping up, insofar as the ideals of liberalism and an entrepreneurial mindset are present, technological progress would ensue, resulting in greater productivity gains, which would lead to more output. Be that as it may, in view of the fact we live in the debt-based Eurodollar system and noone - specially our rulers and the businesses and individuals who have gained tremendously with all this inflation - wants to experience a deflationary event, the debt gorge must go on. Unsurprisingly, the level of global debt is forecasted to soar till 2030 by roughly $100 trn. 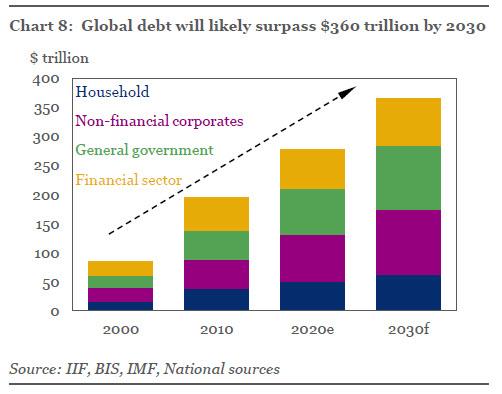 To conclude, it would be one thing if this debt surge came just from the private sector. In this case, only those who accrued them would be the ones to service the debt, and if they for some reason became uncapable of servicing the debt, they would be the only ones in distress. However, because our governments and legislators cannot prevent themselves from smothering us with their love, we are all going to have to chip in since we have all benefited from their largesse (in some form or the other), whether you asked for it or not. Surely, they even have a list full of names to keep track - possibly divided in naughty and nice. Perhaps it is not in the stocking you ought to be looking at. You'd better take a look outside. What is that? What are those piles made up of? Is it snow? Maybe the carol singers have the answer. Oh, the virus outside is frightful But the vaccine is so delightful And since we've no place to go Let it borrow, let it borrow, let it borrow Man, it doesn't show signs of stopping And the auctions are really popping The yields are turned way down low Let it borrow, let it borrow, let it borrow  |
AuthorDaniel Gomes Luís Archives
March 2024
Categories |
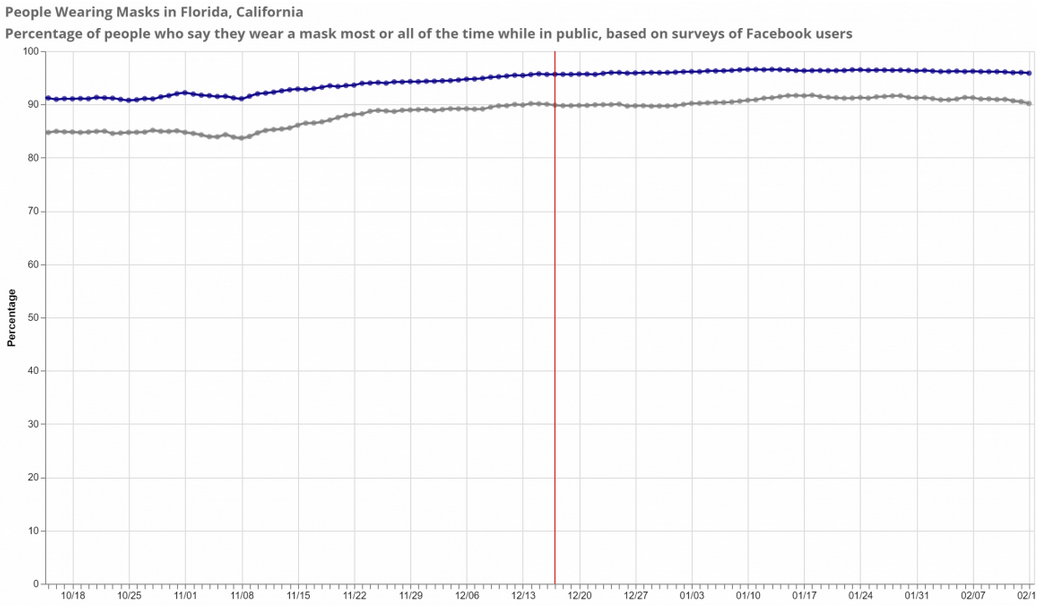
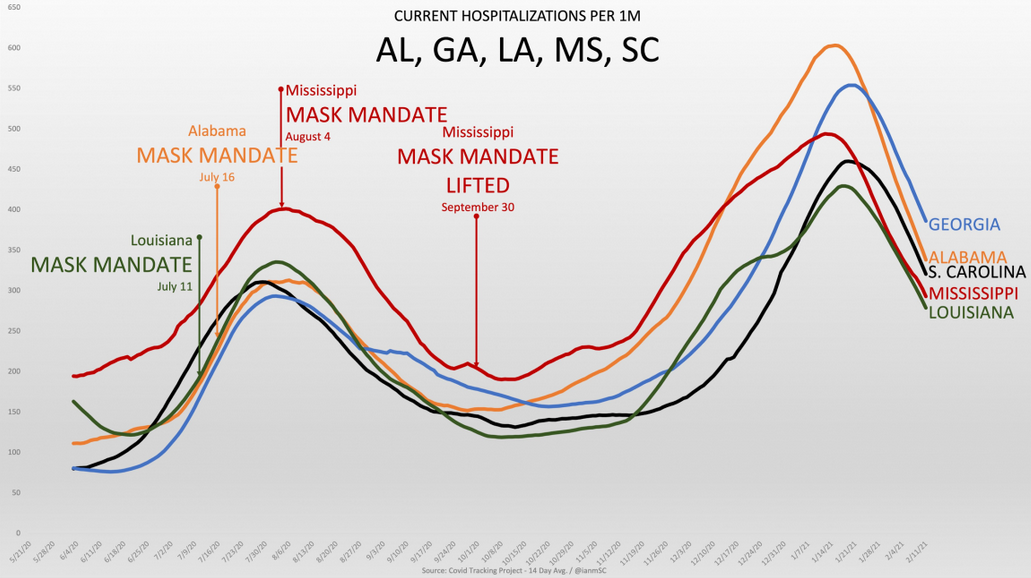
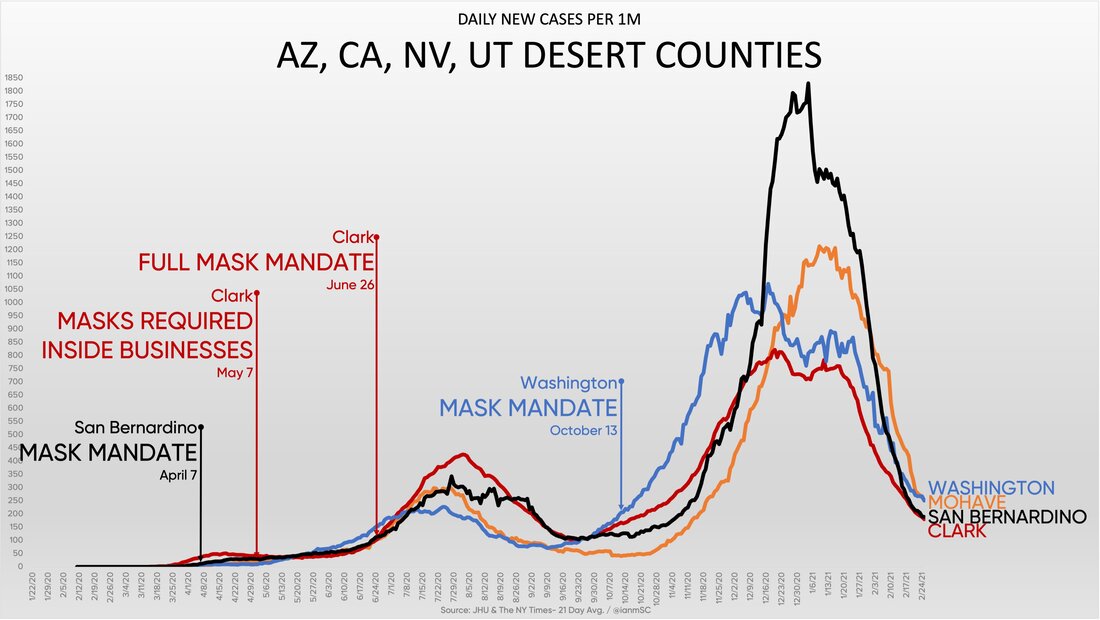
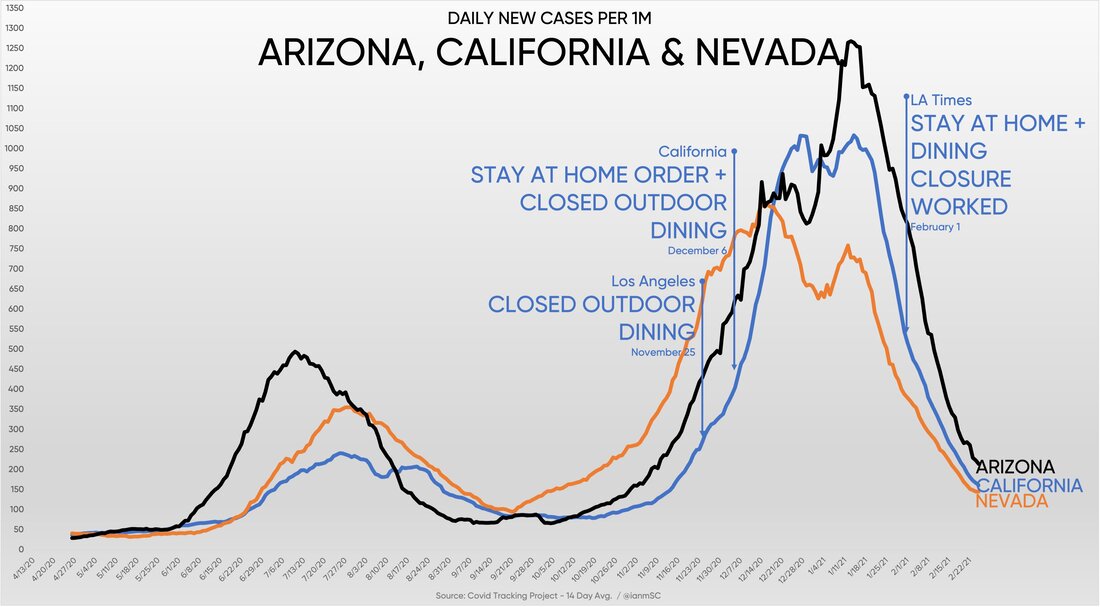
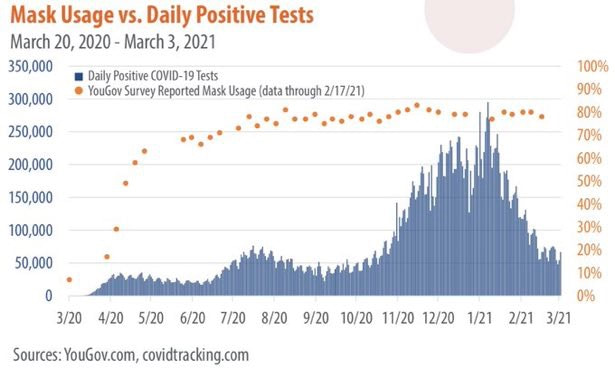
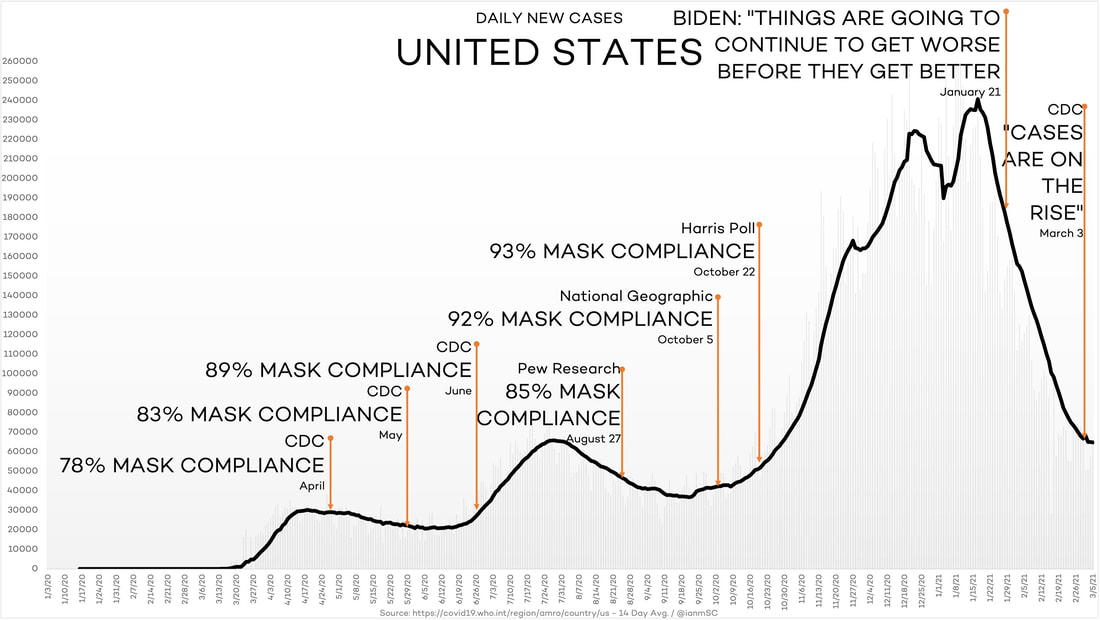
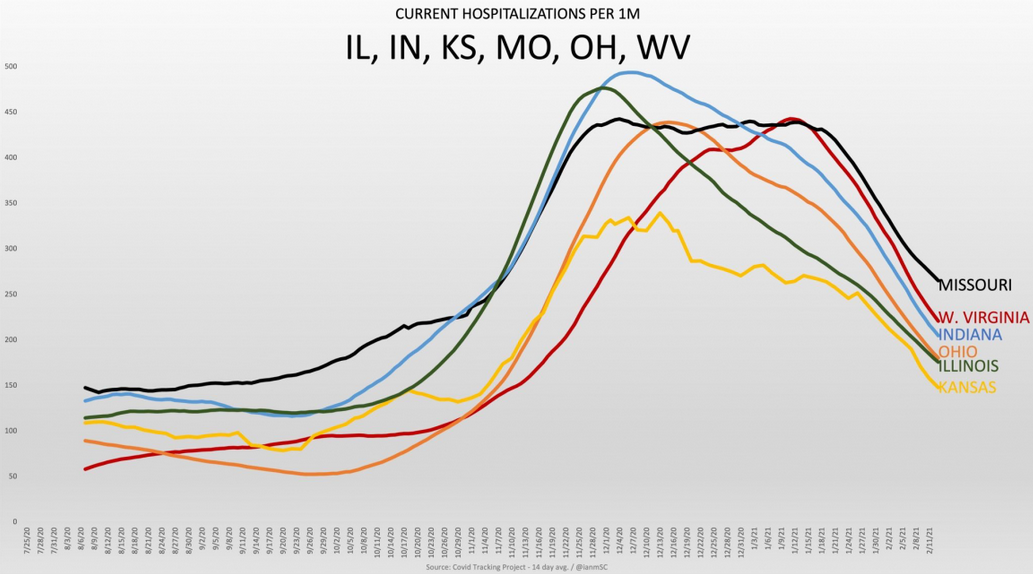
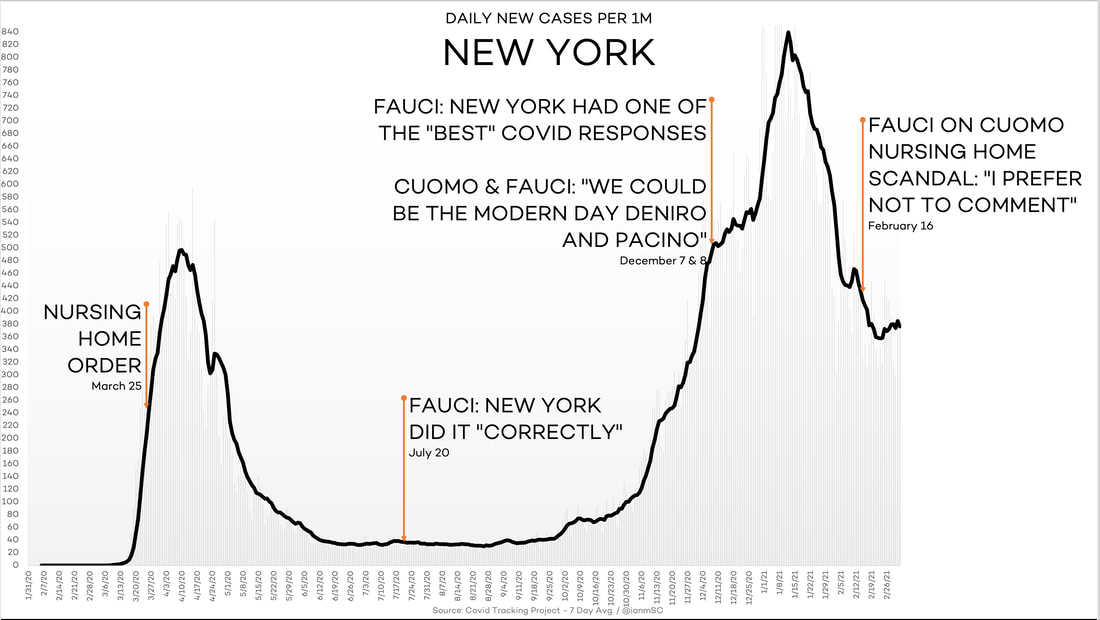
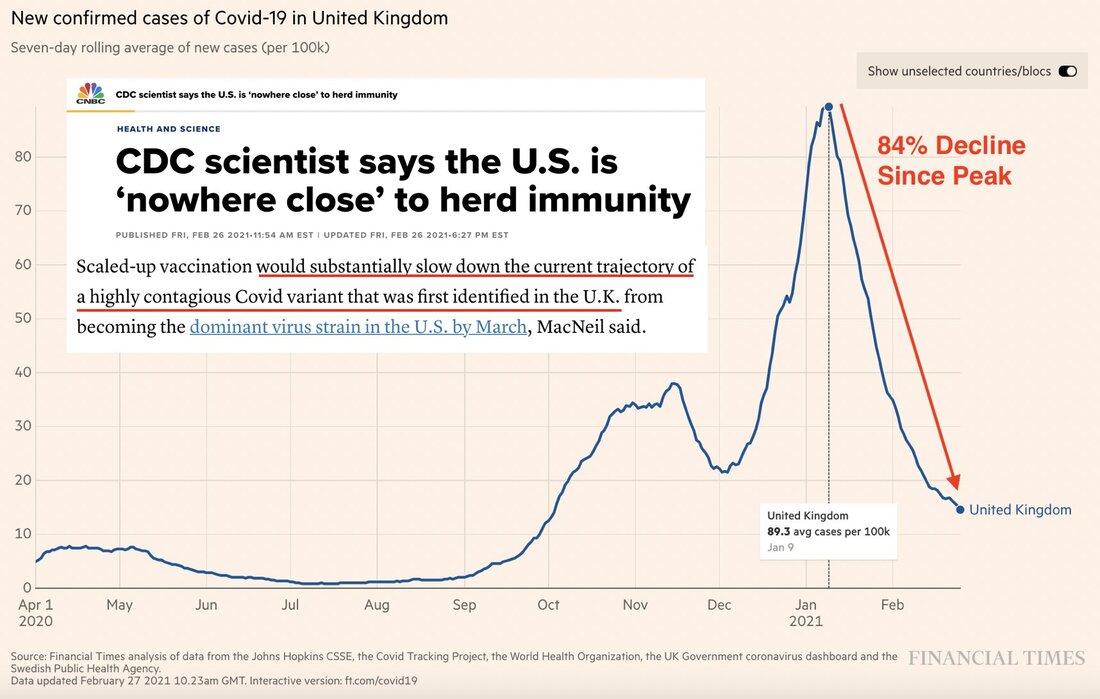
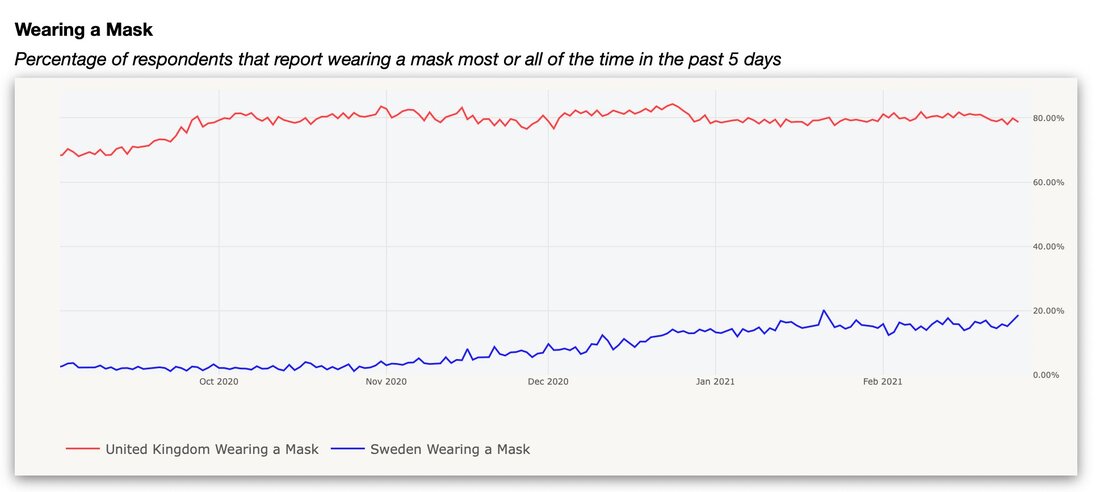
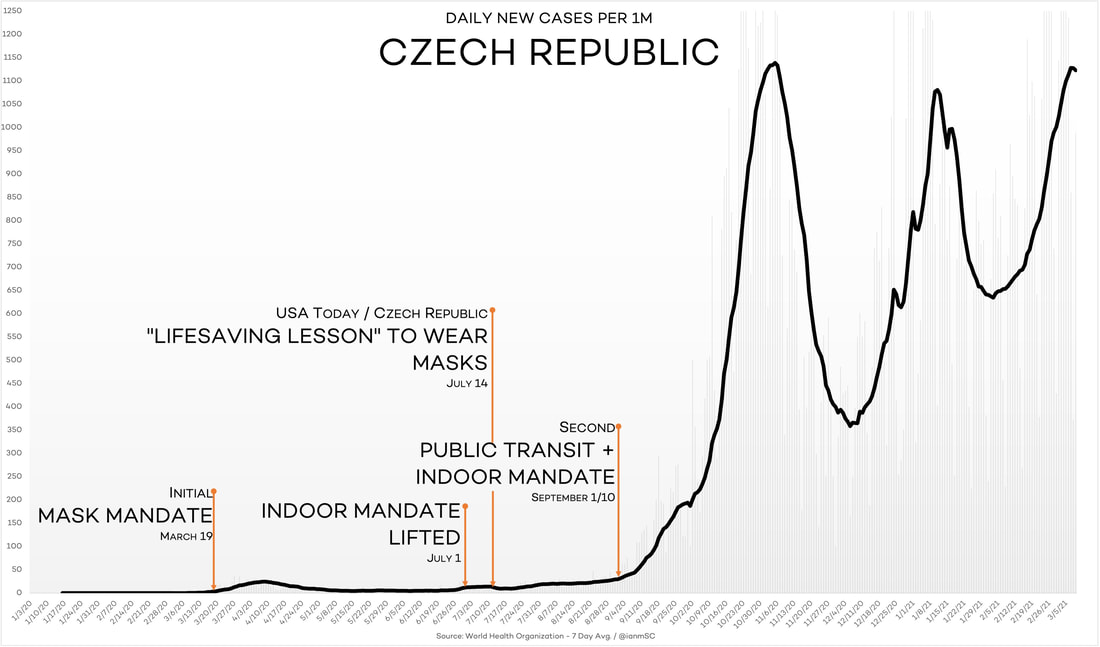
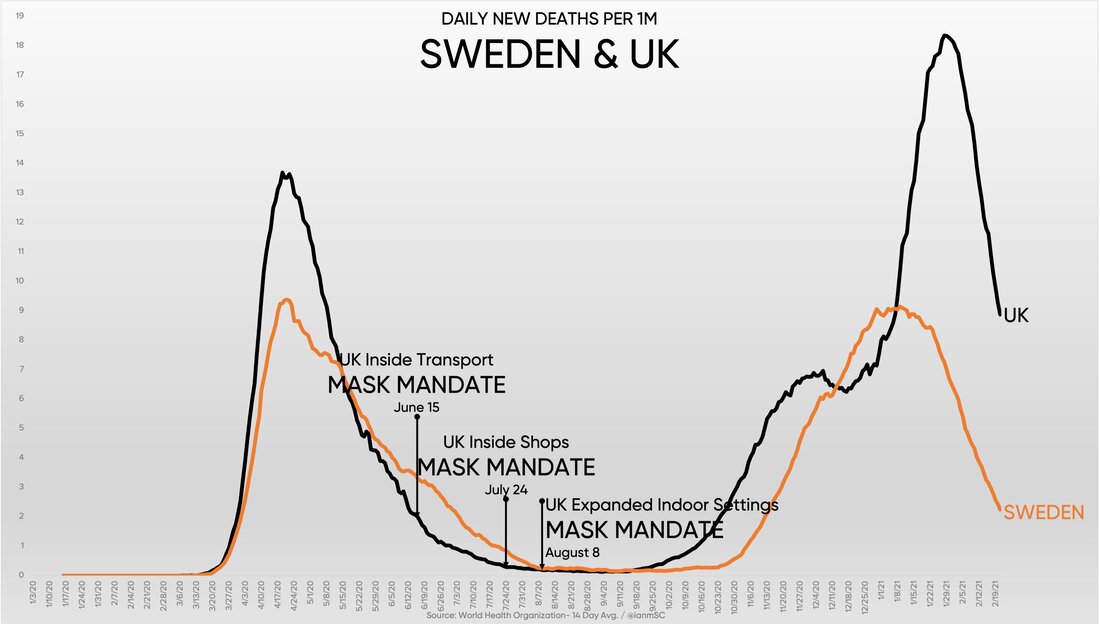
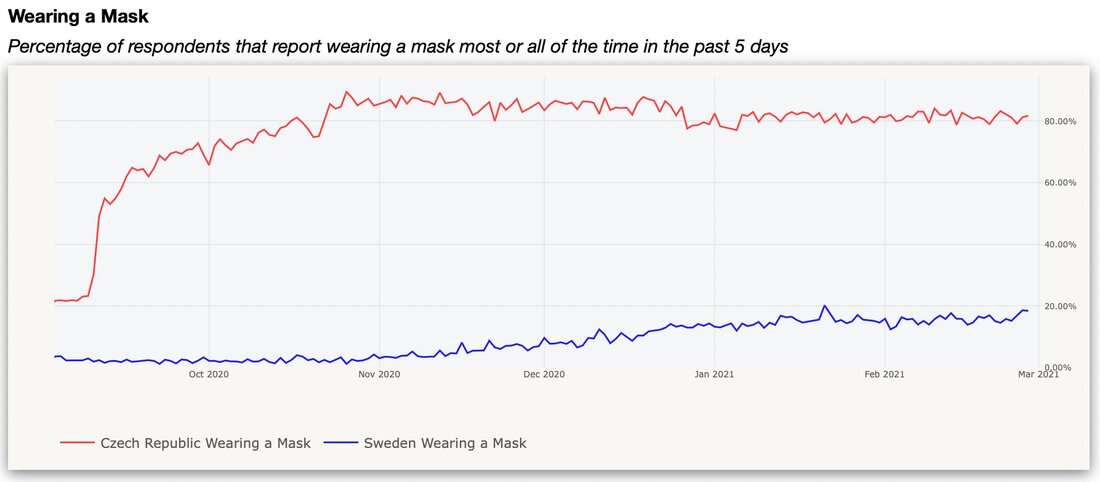
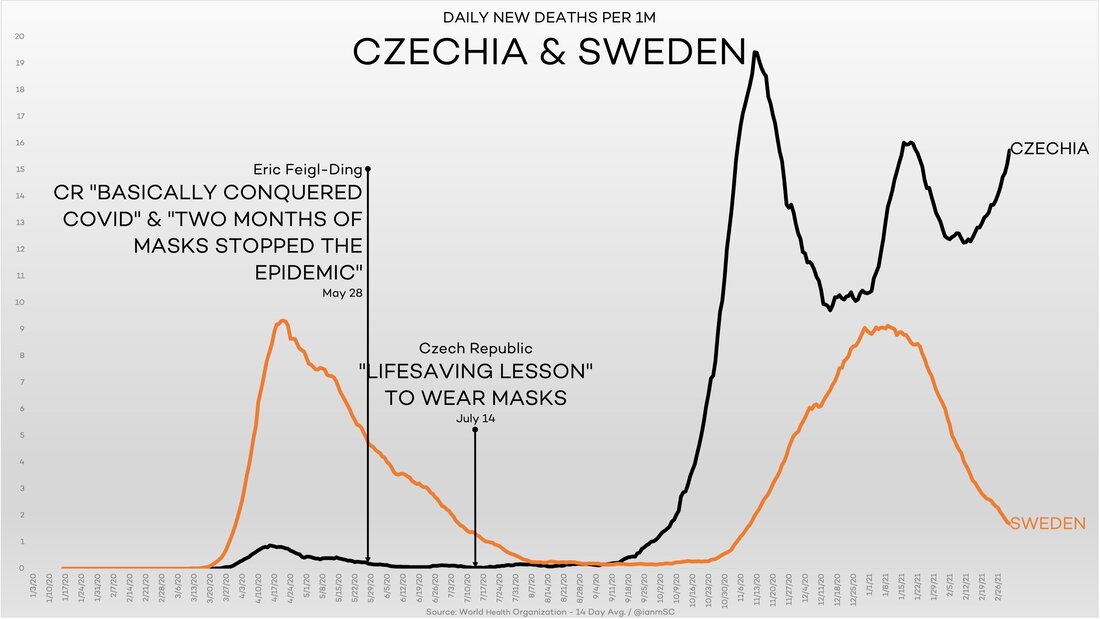
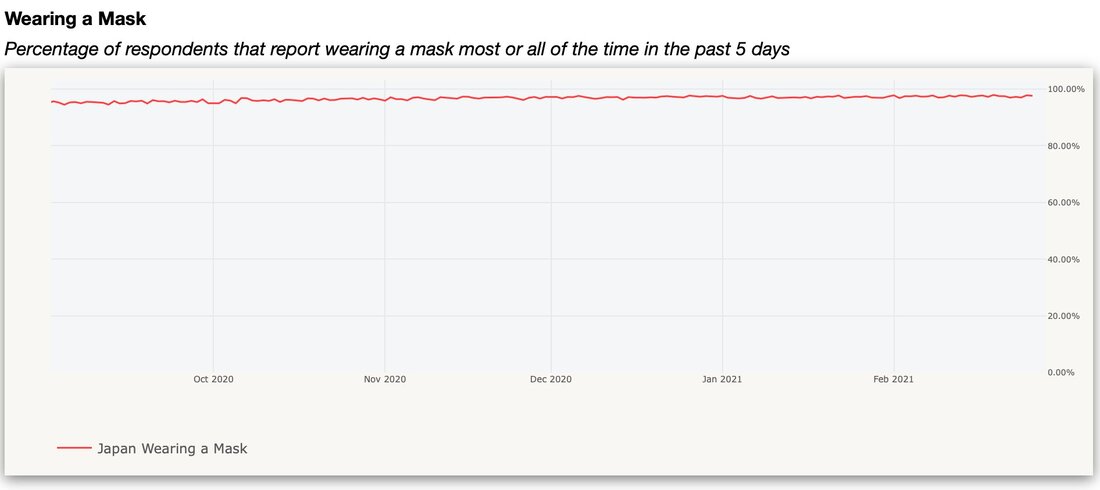
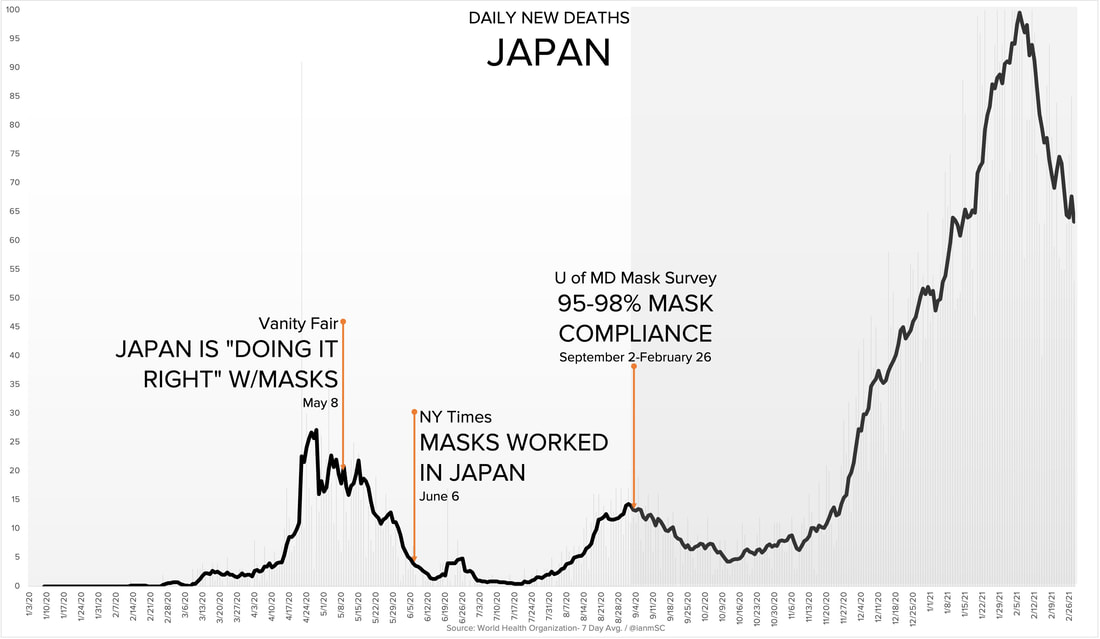
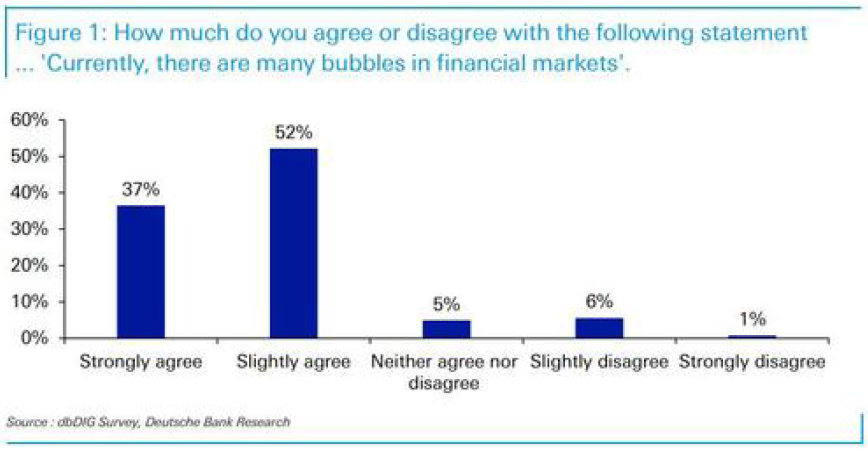
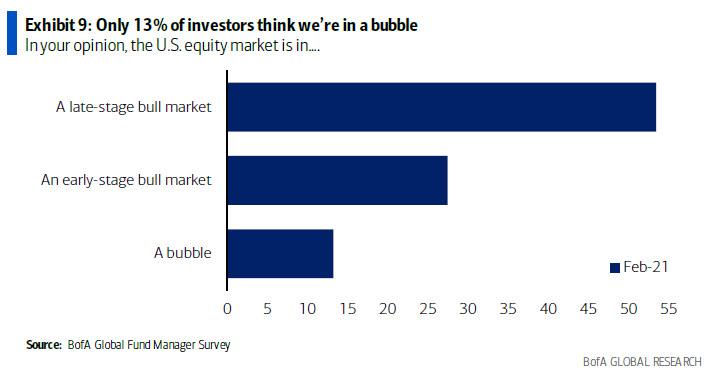
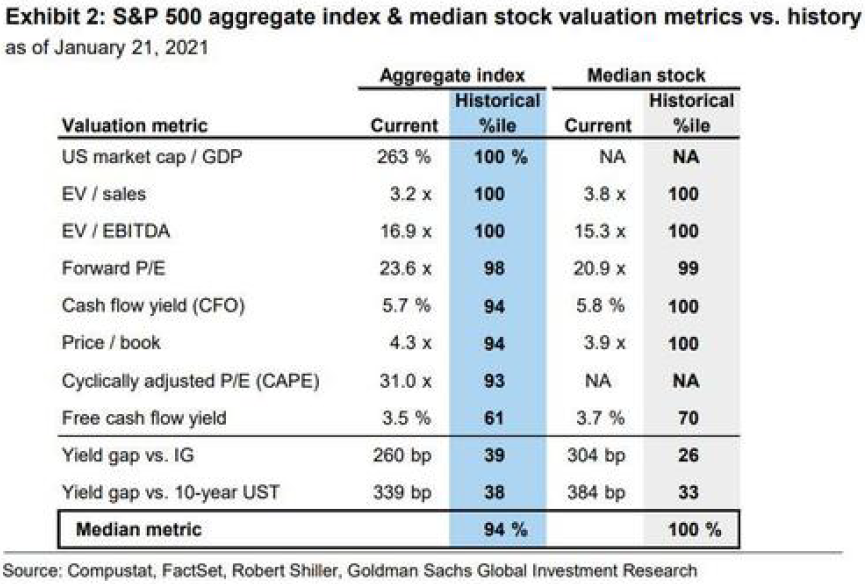
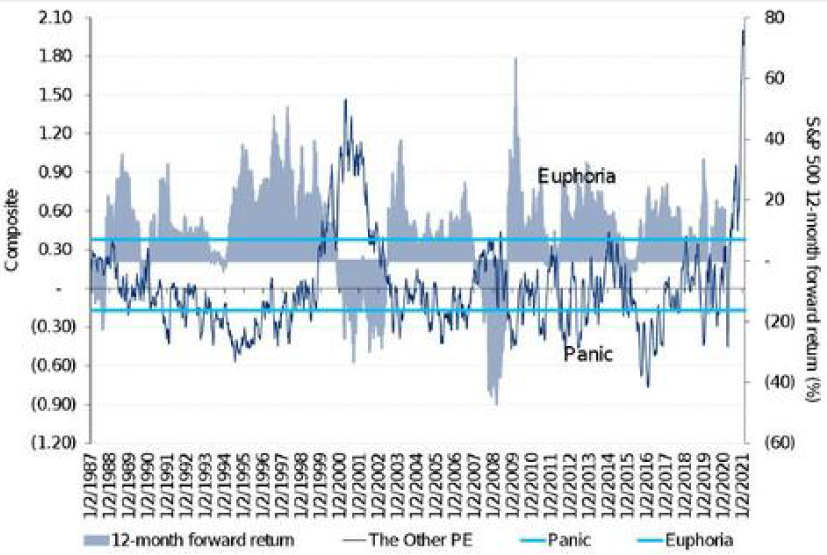
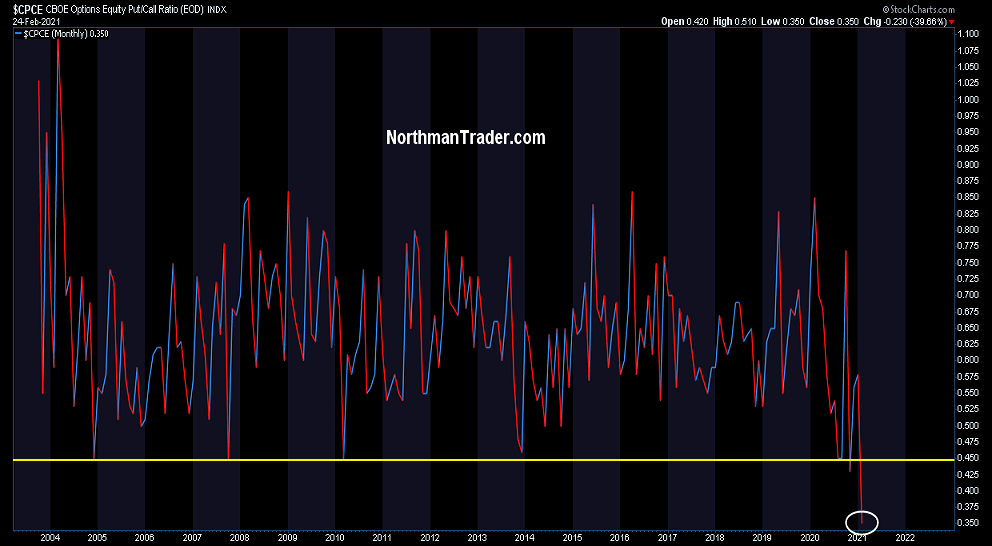
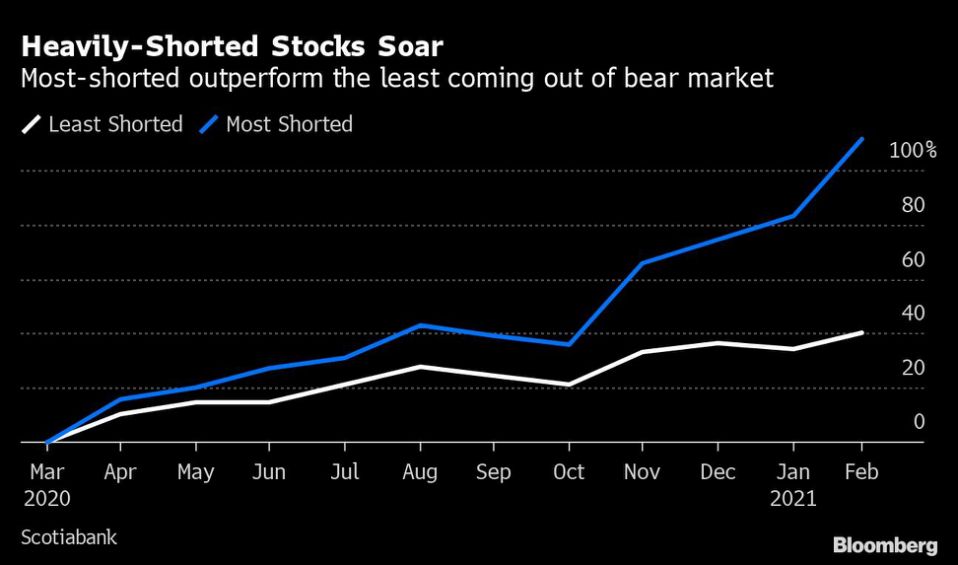
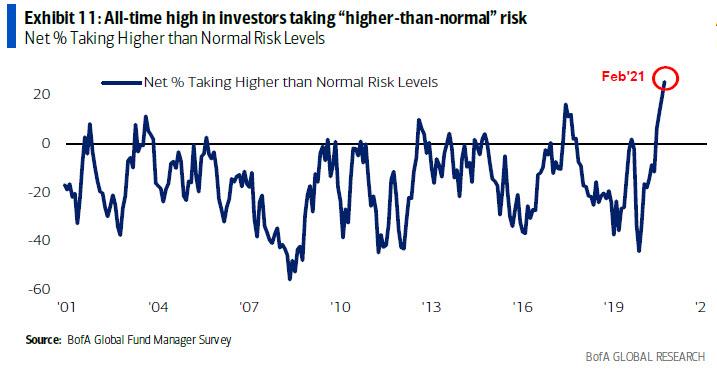
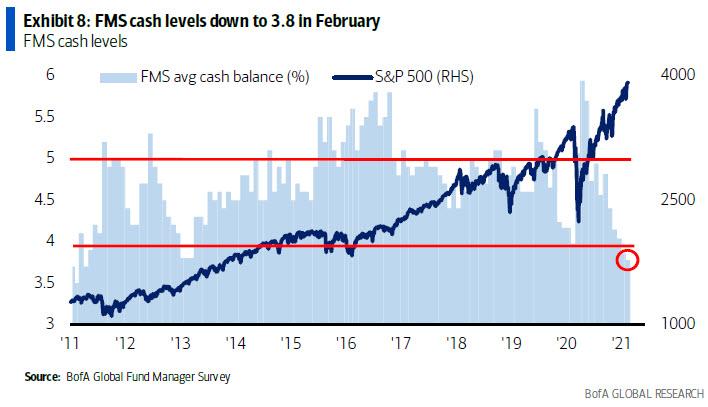
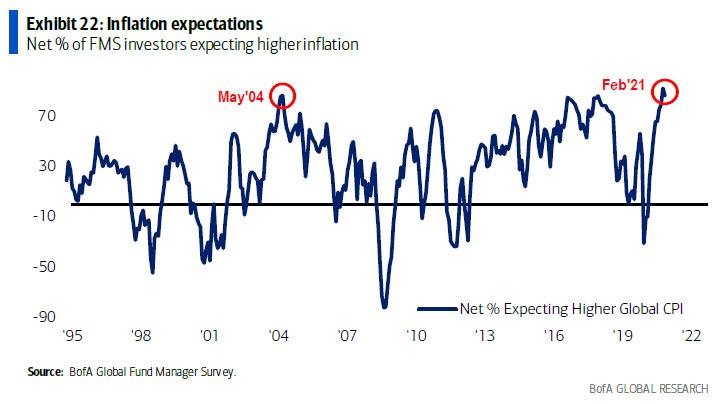
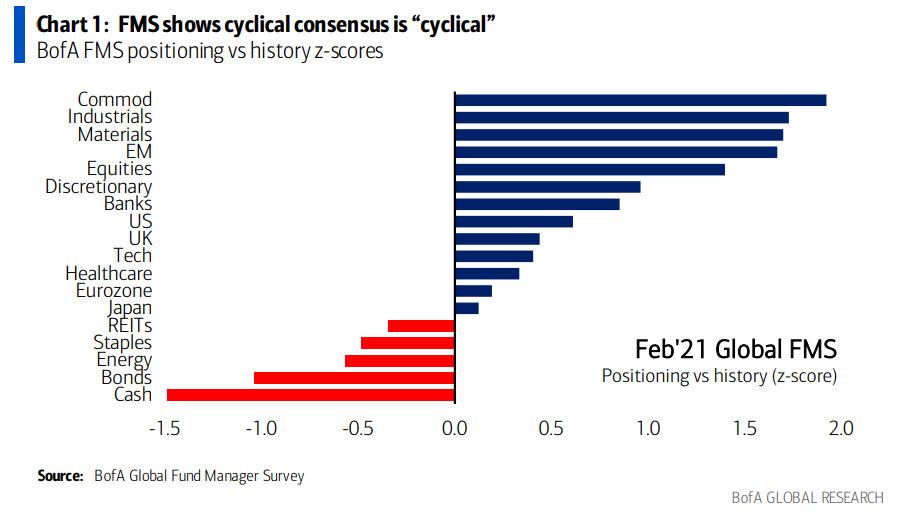
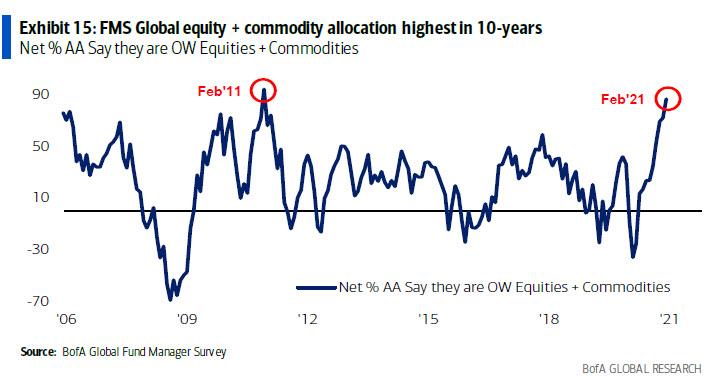
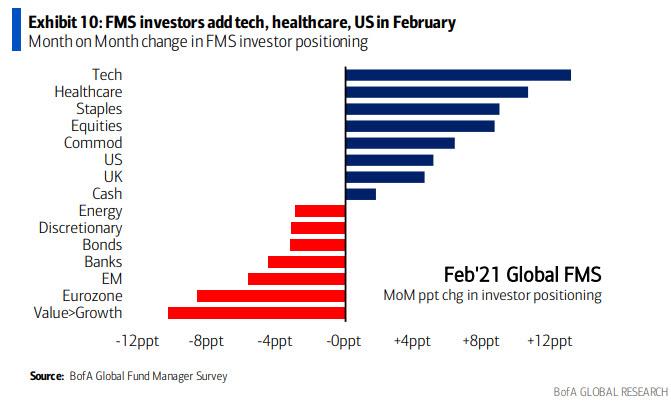
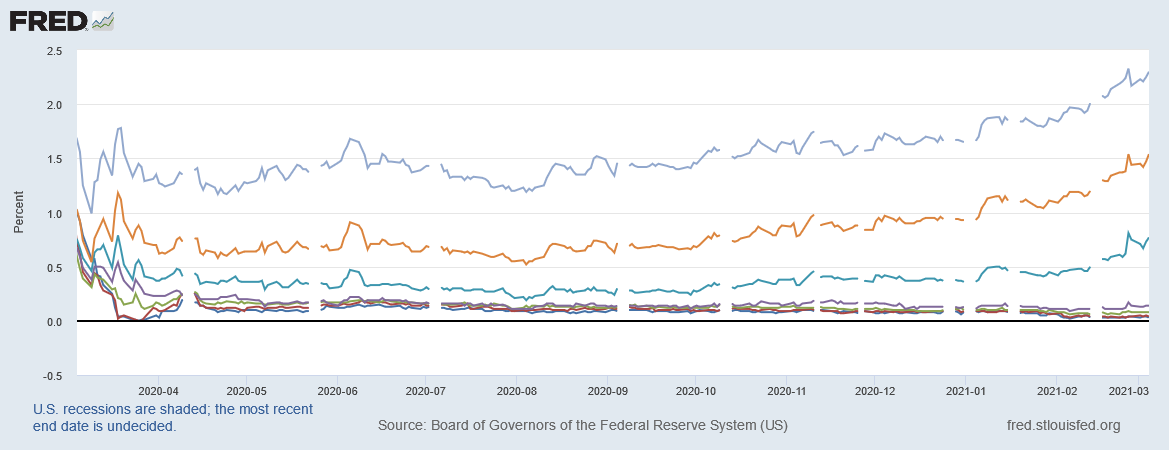
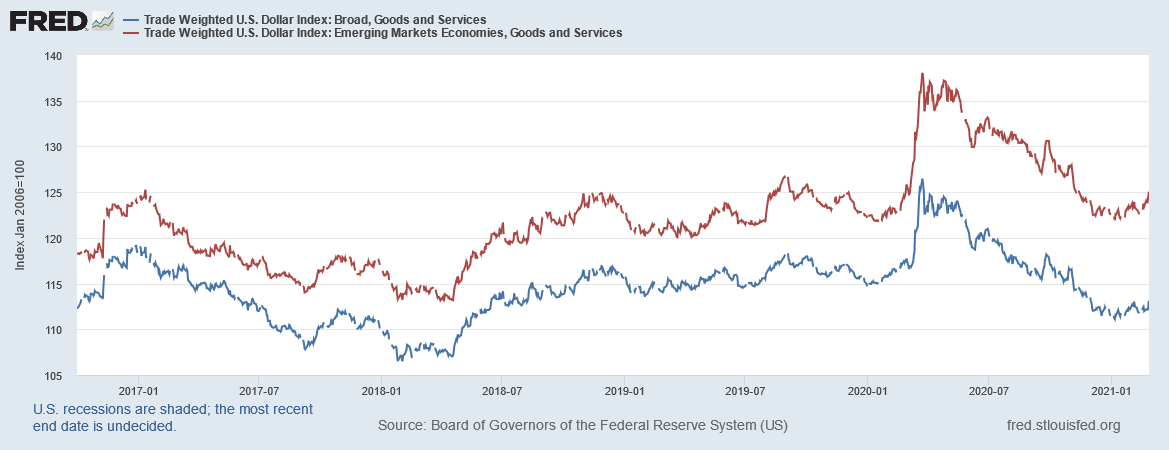
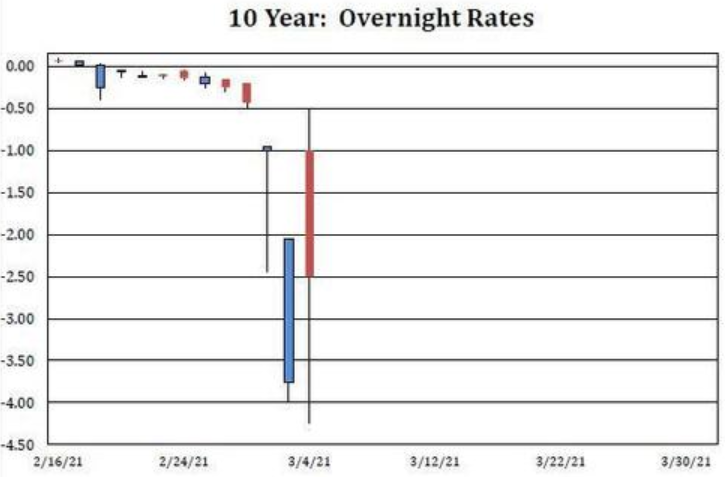
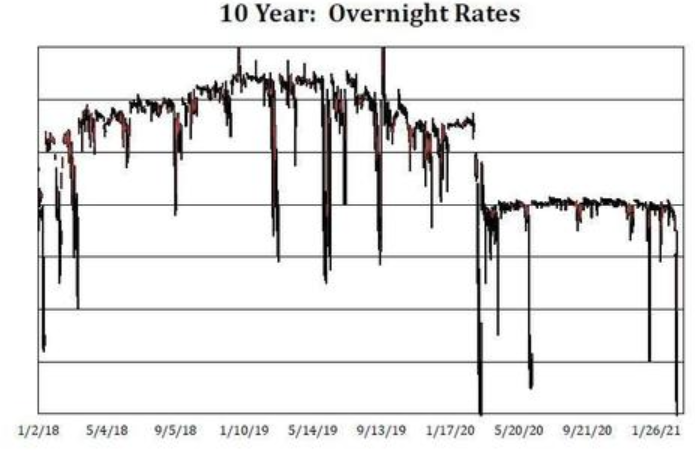
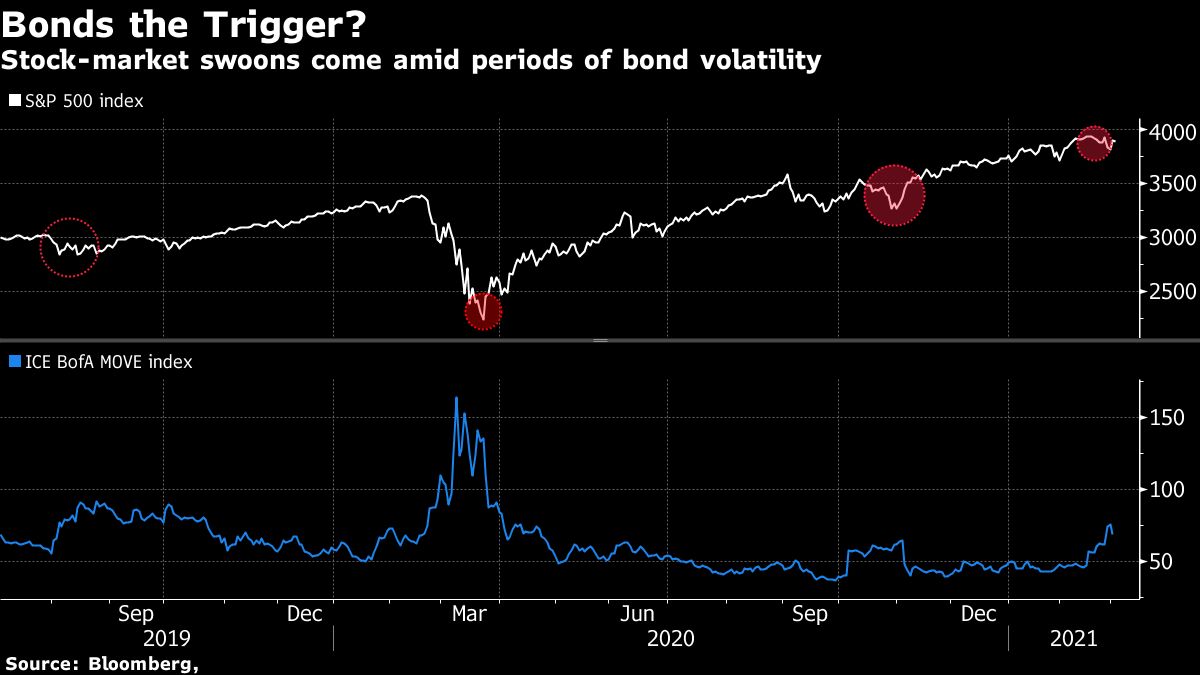
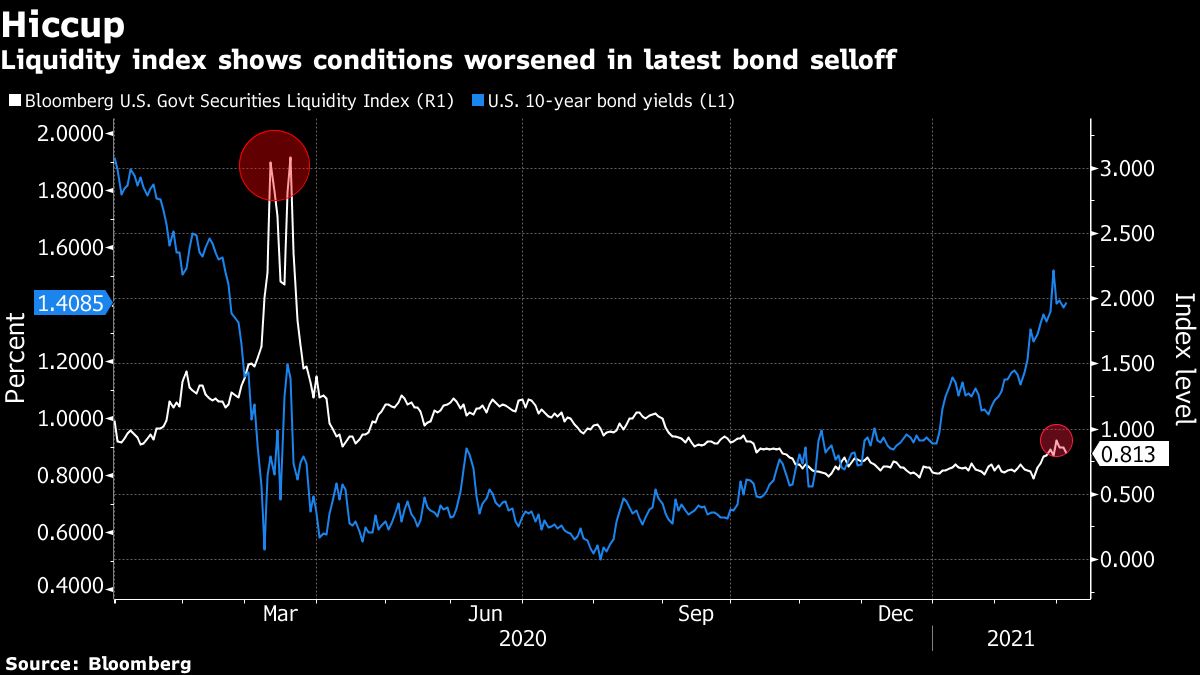
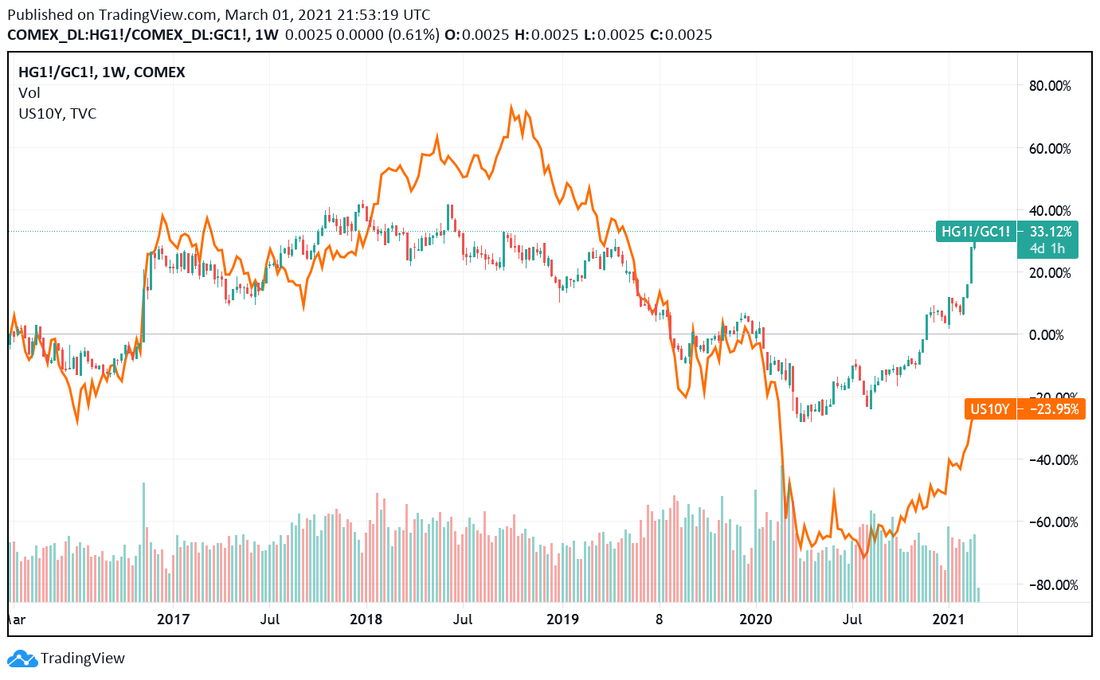
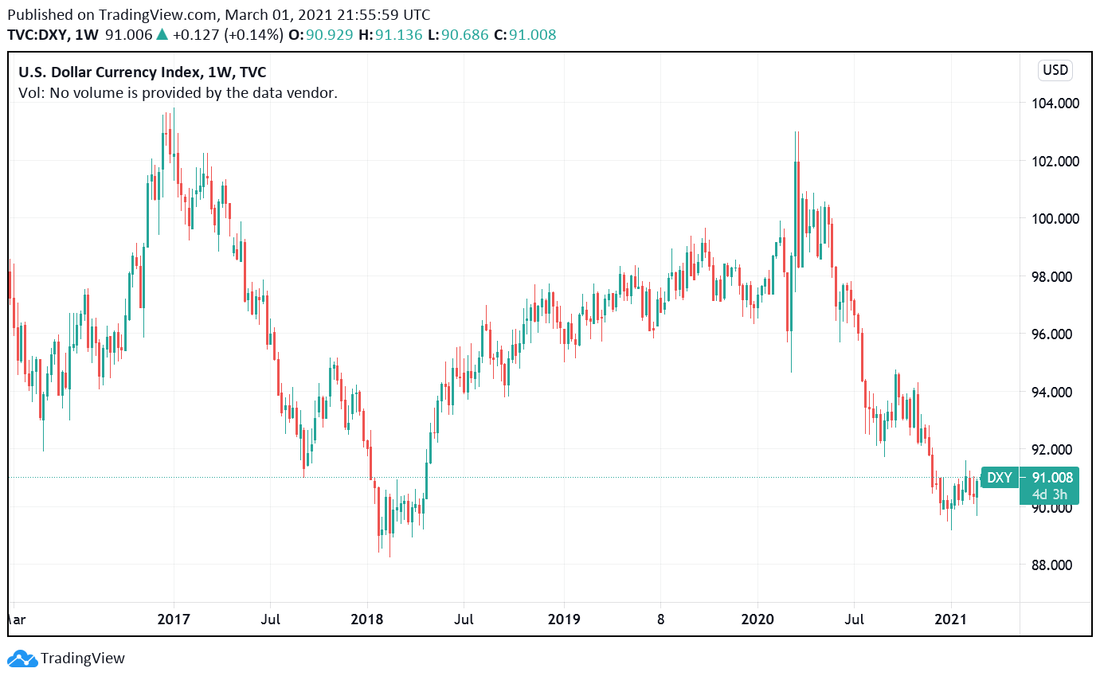
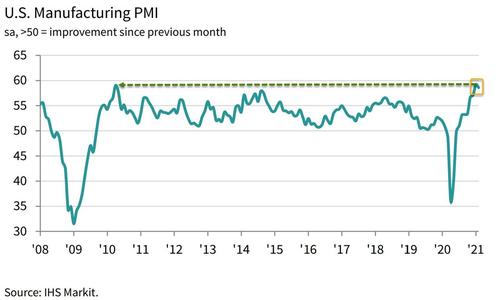
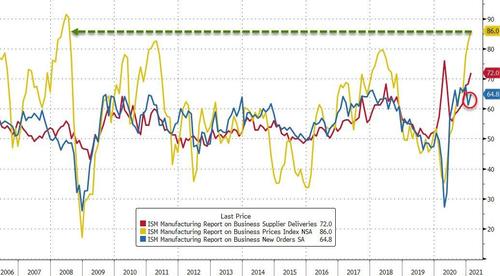
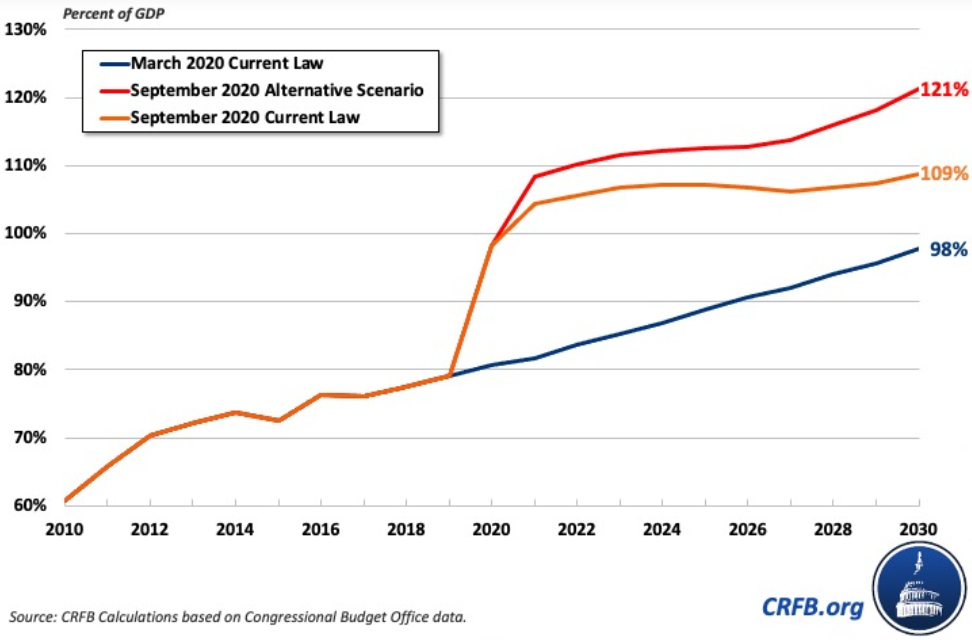
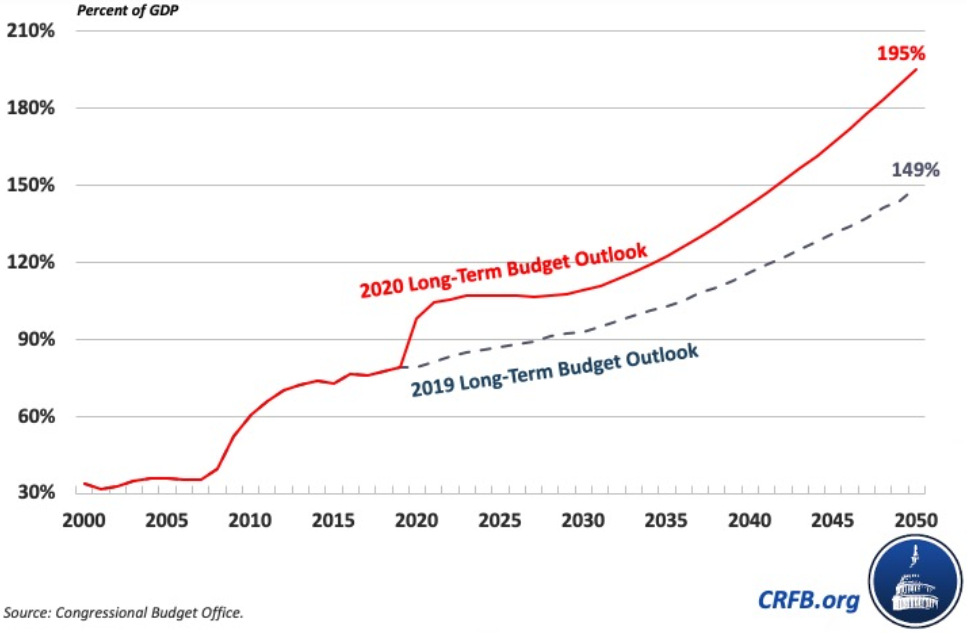
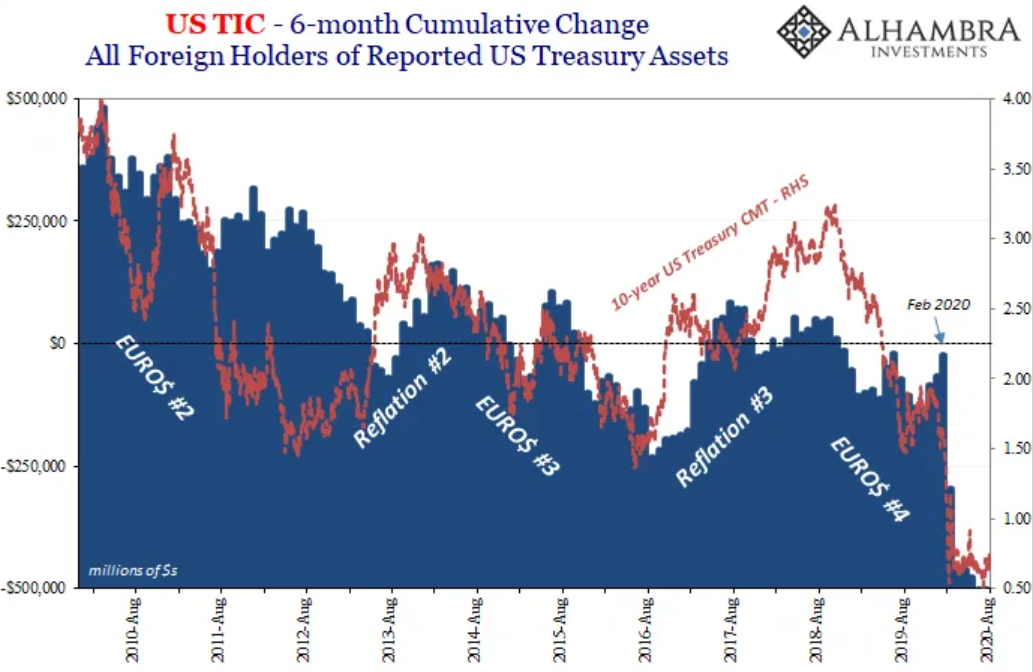
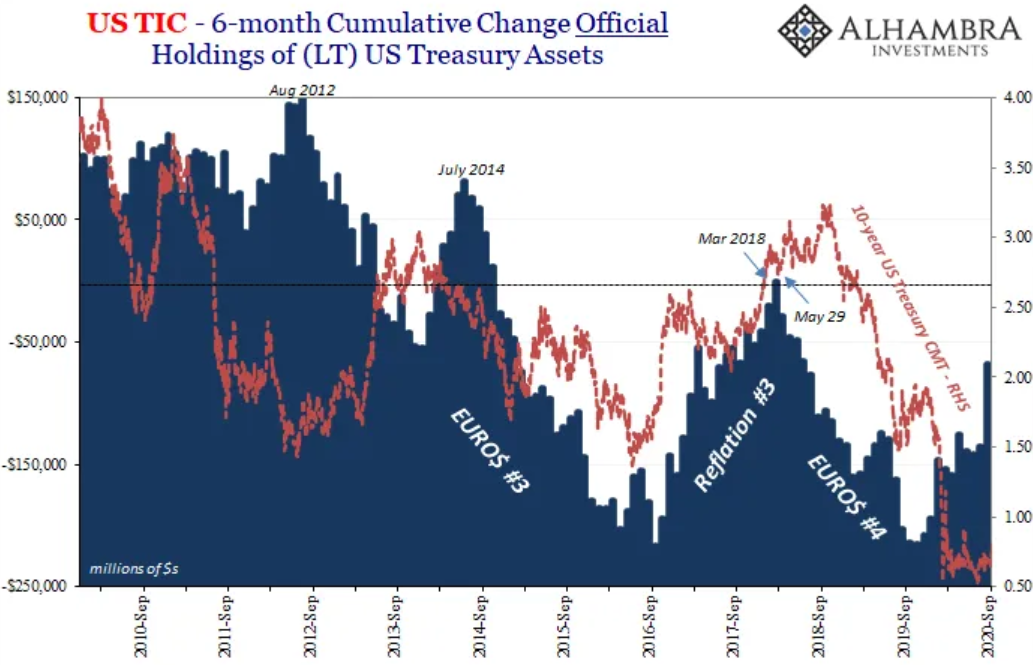
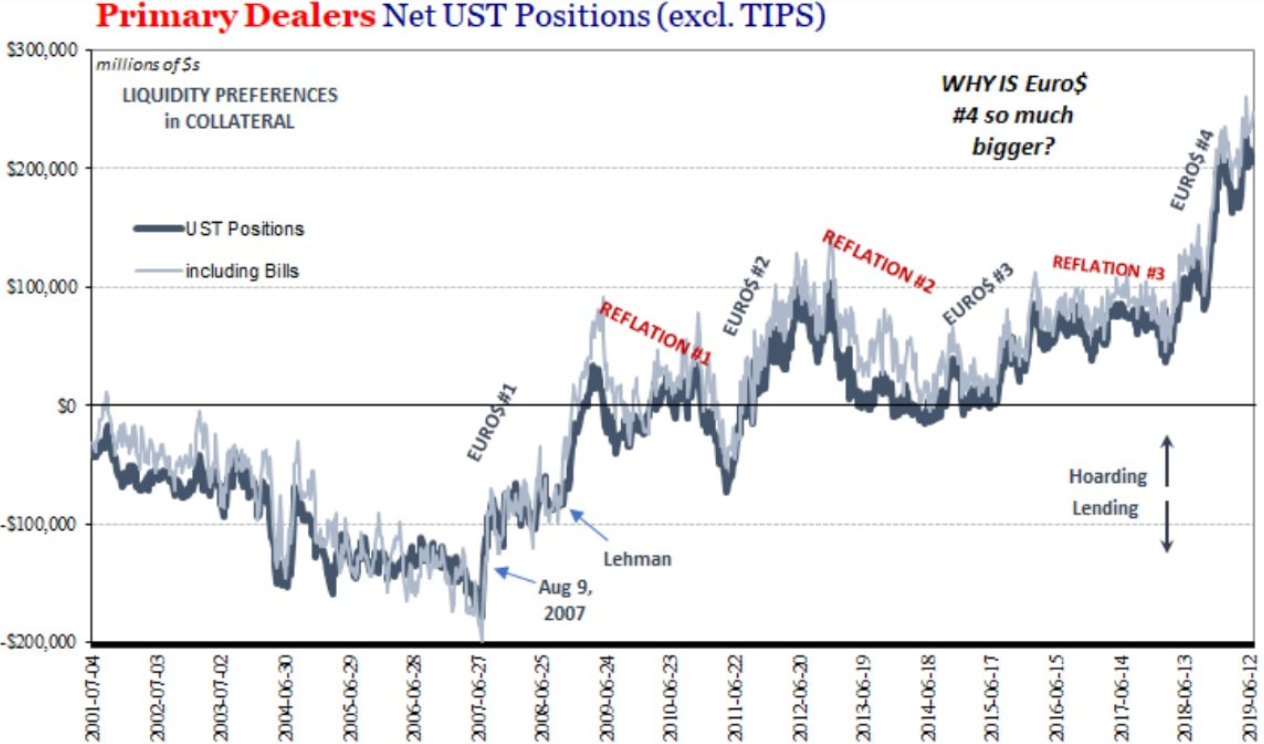
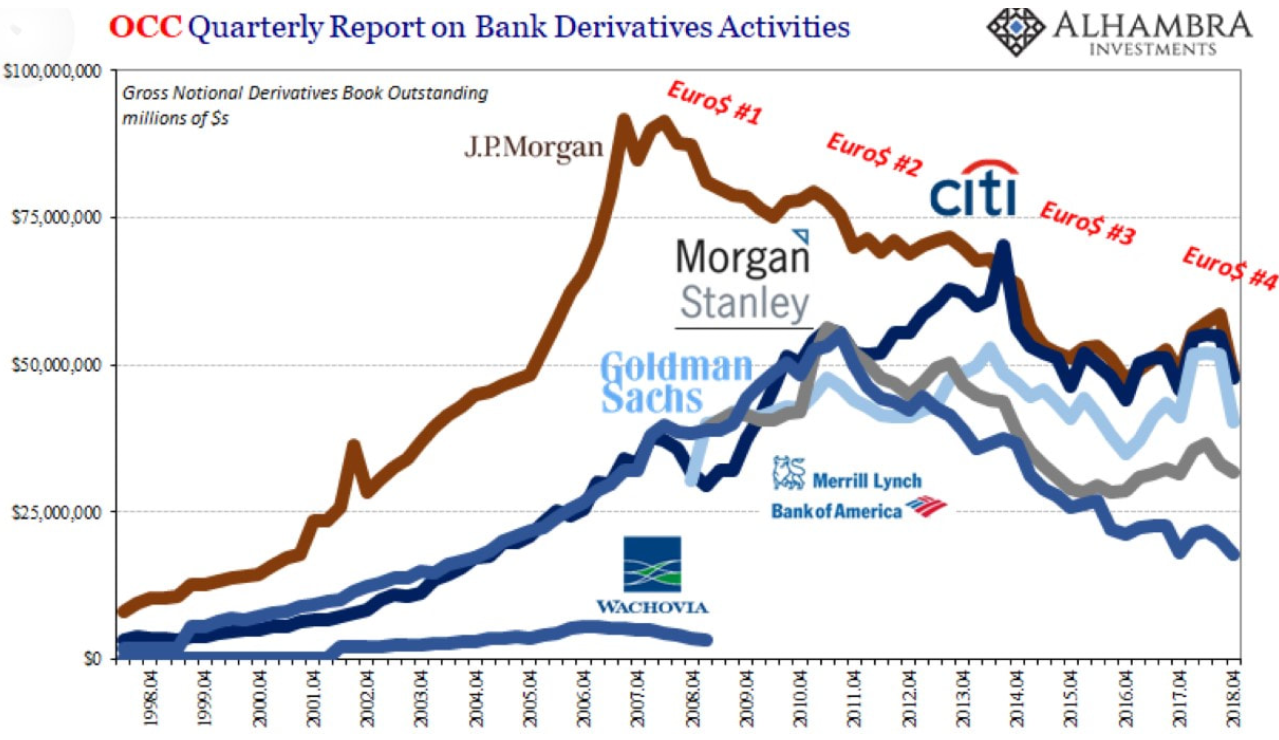
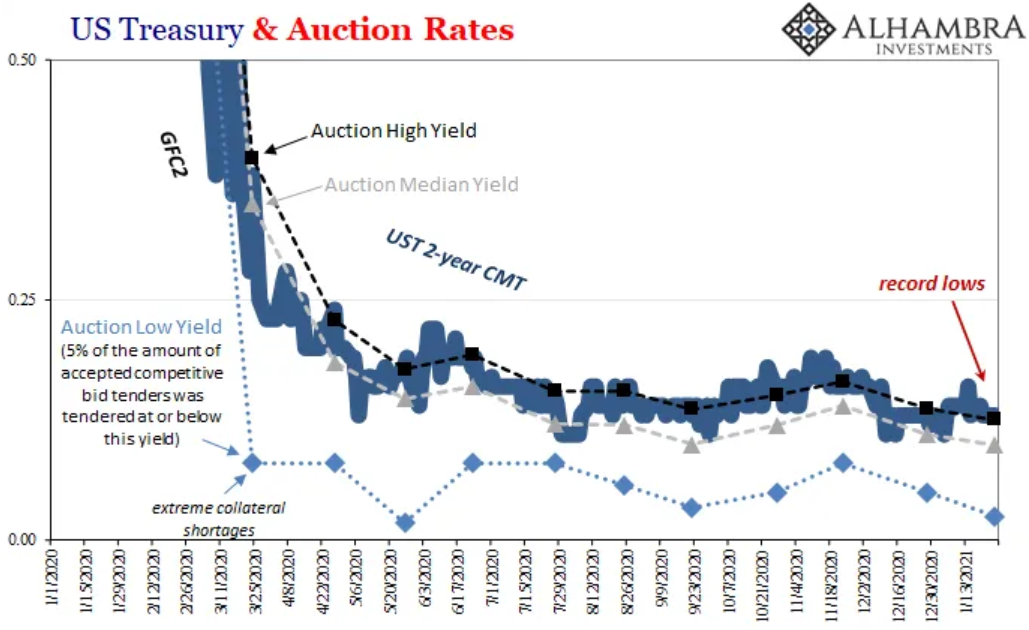
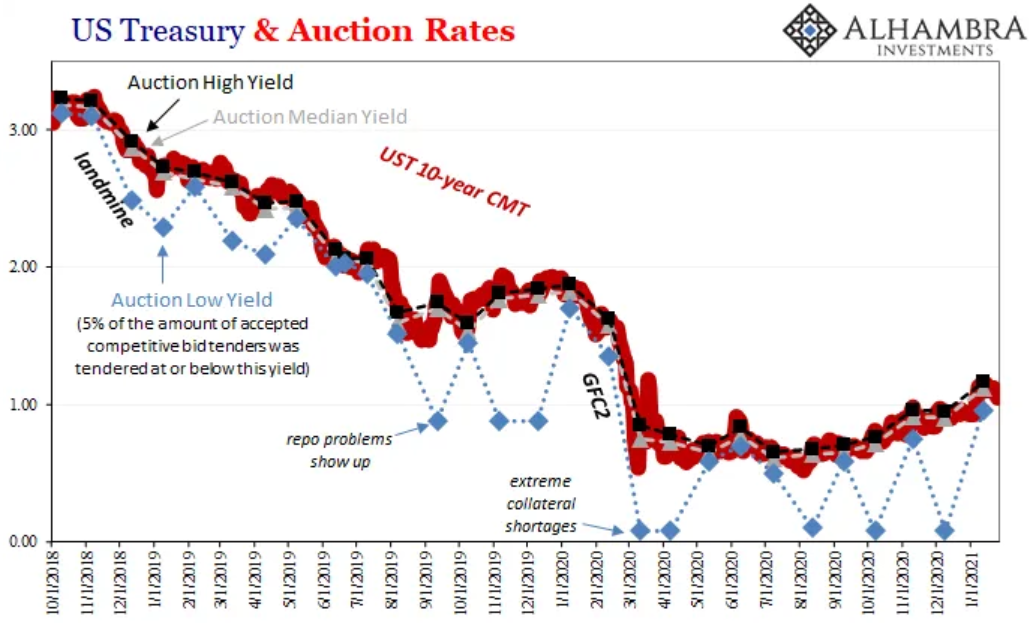
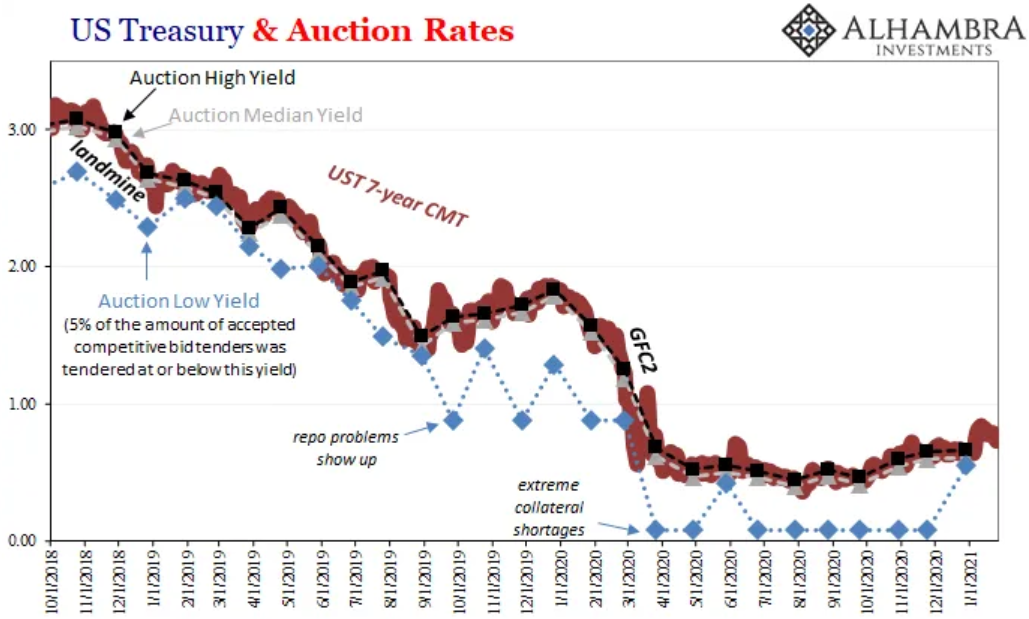
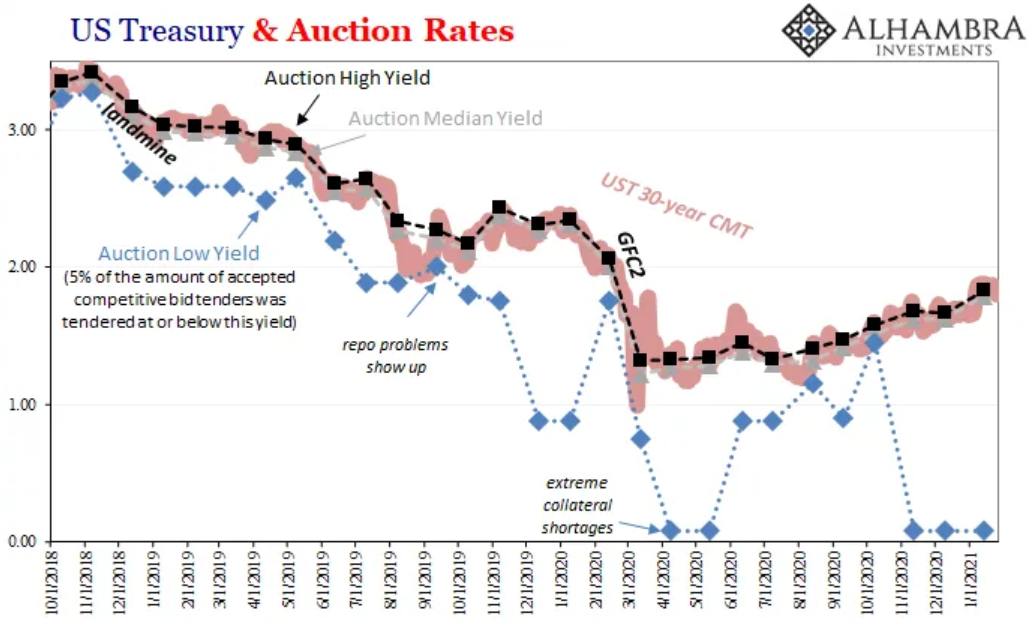
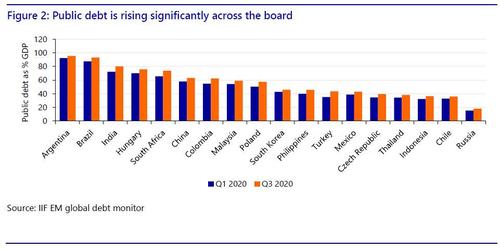
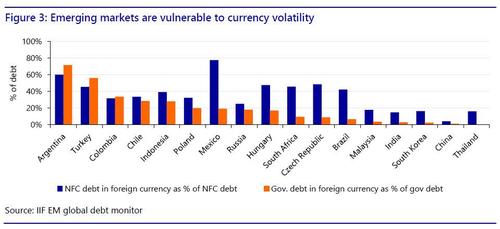
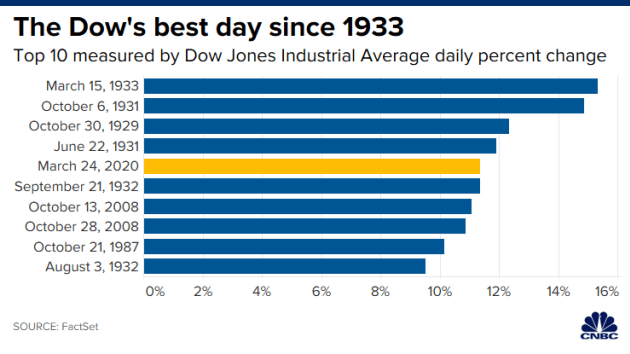
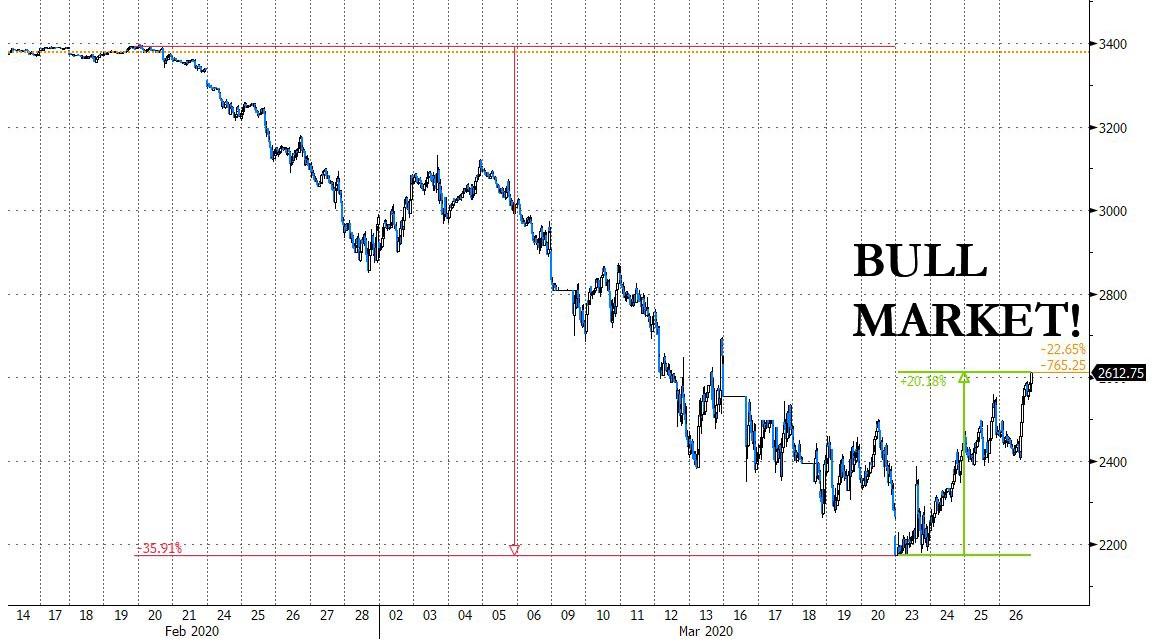
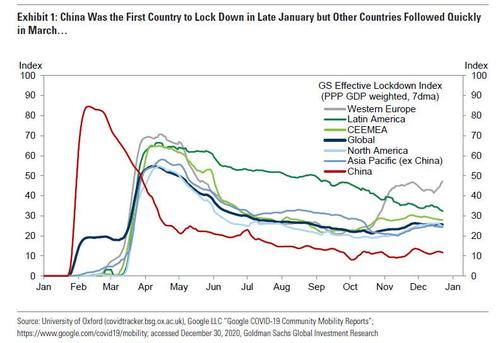
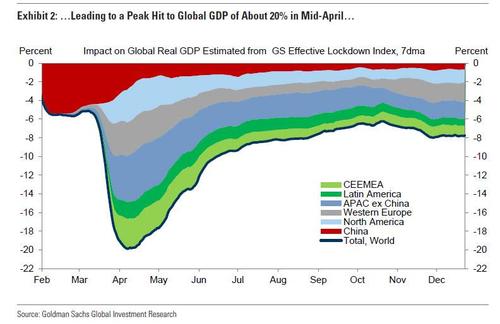
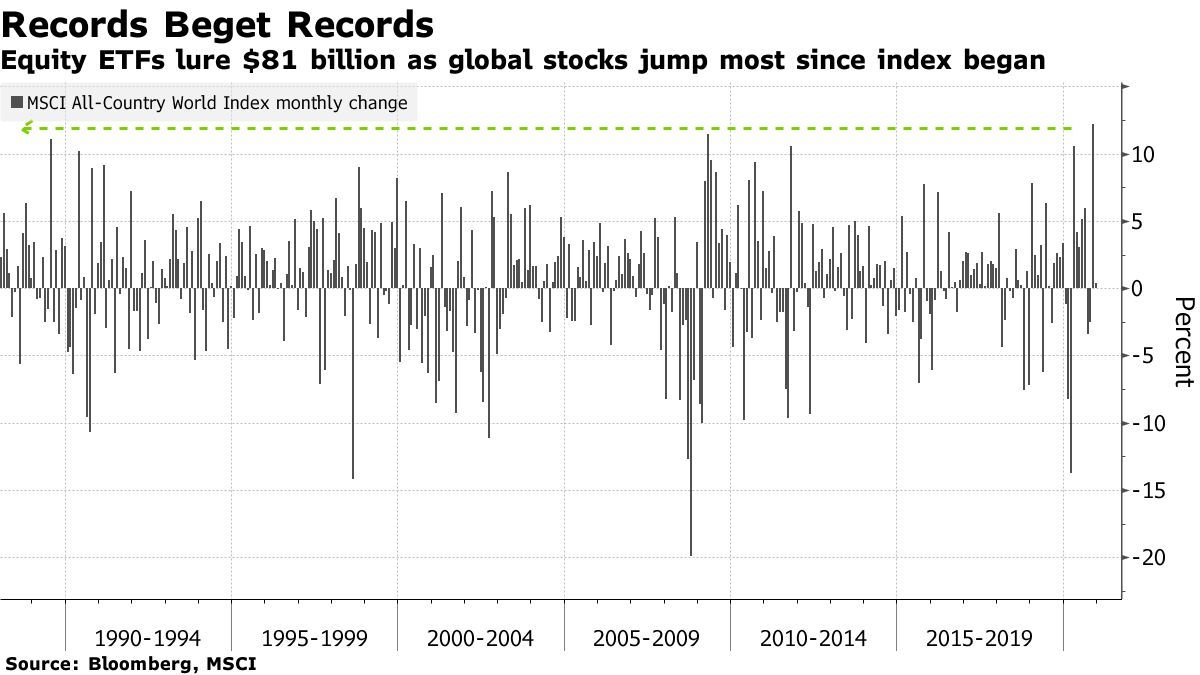
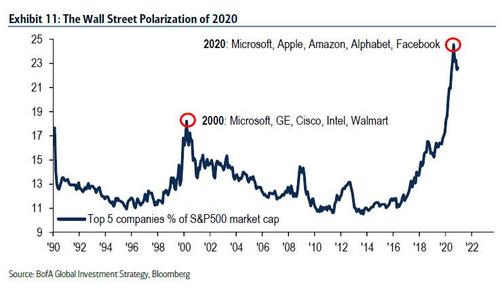
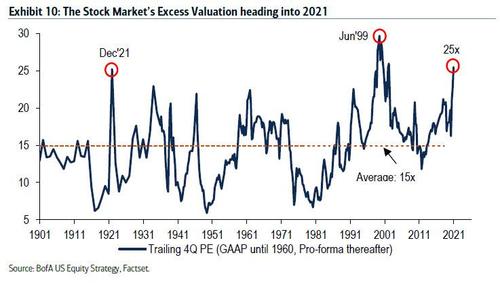
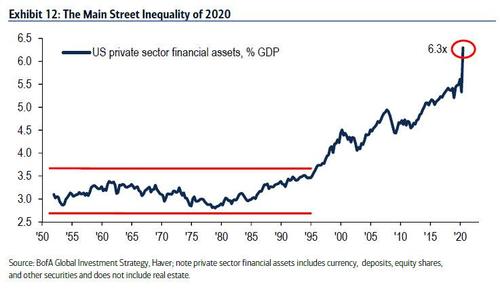
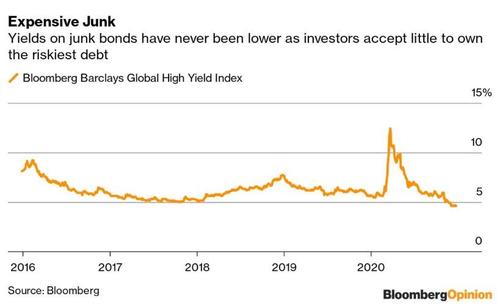
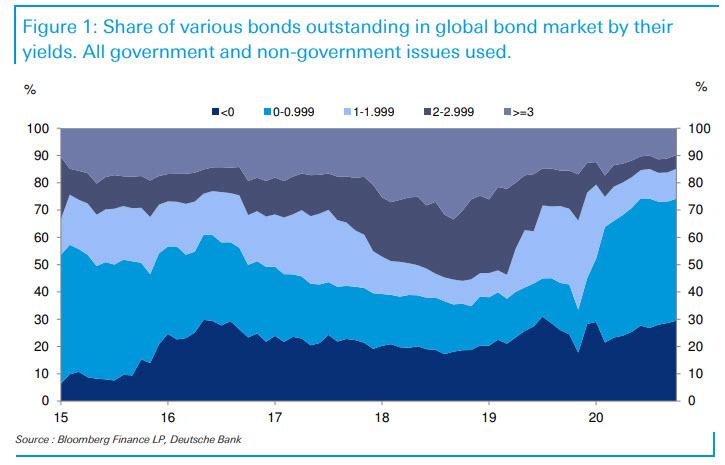
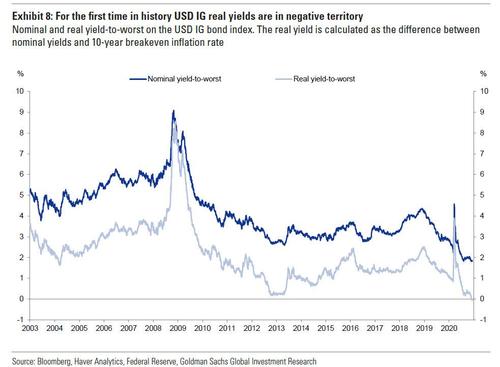
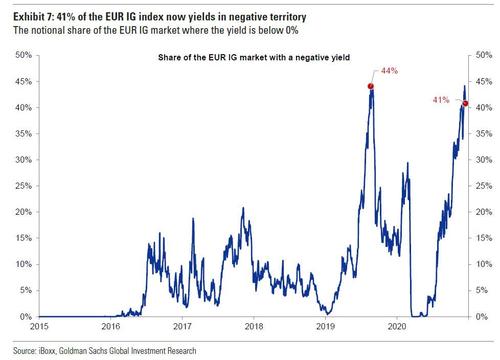
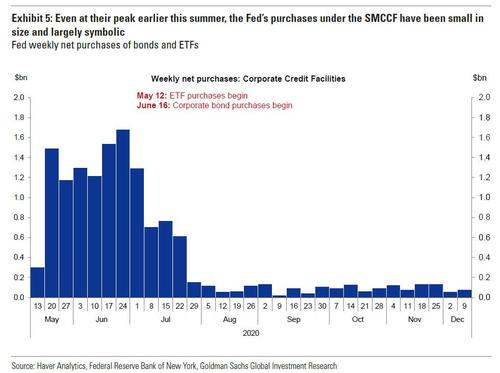
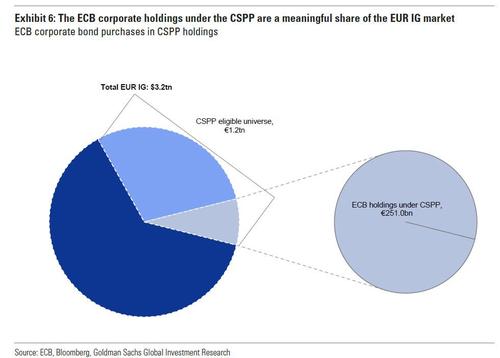
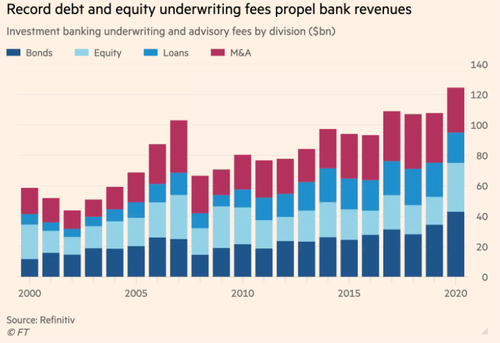
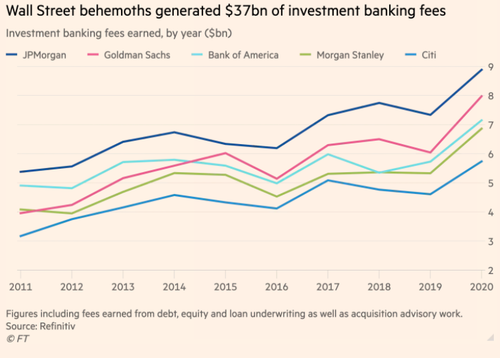
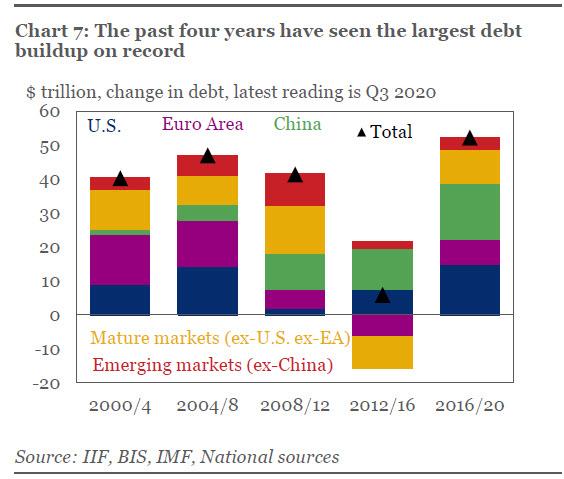
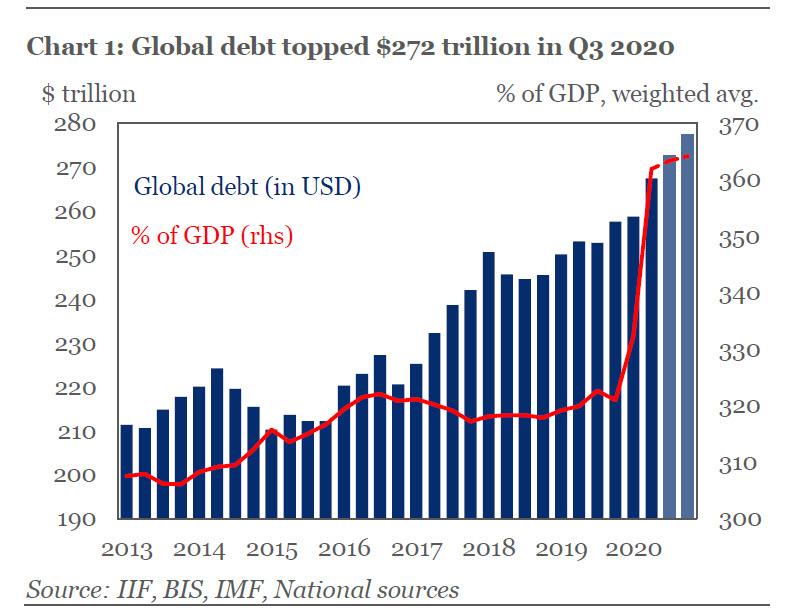
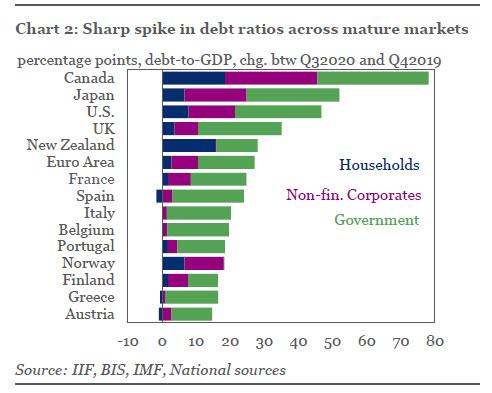
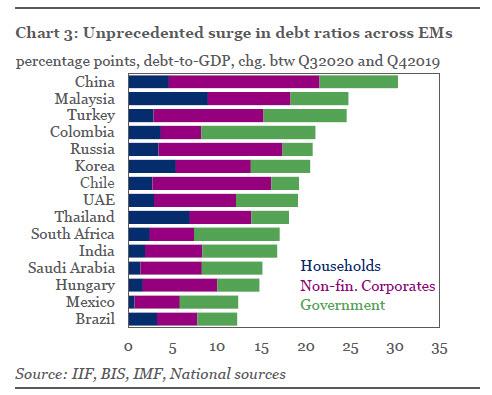
 RSS Feed
